
|
Fig. 2
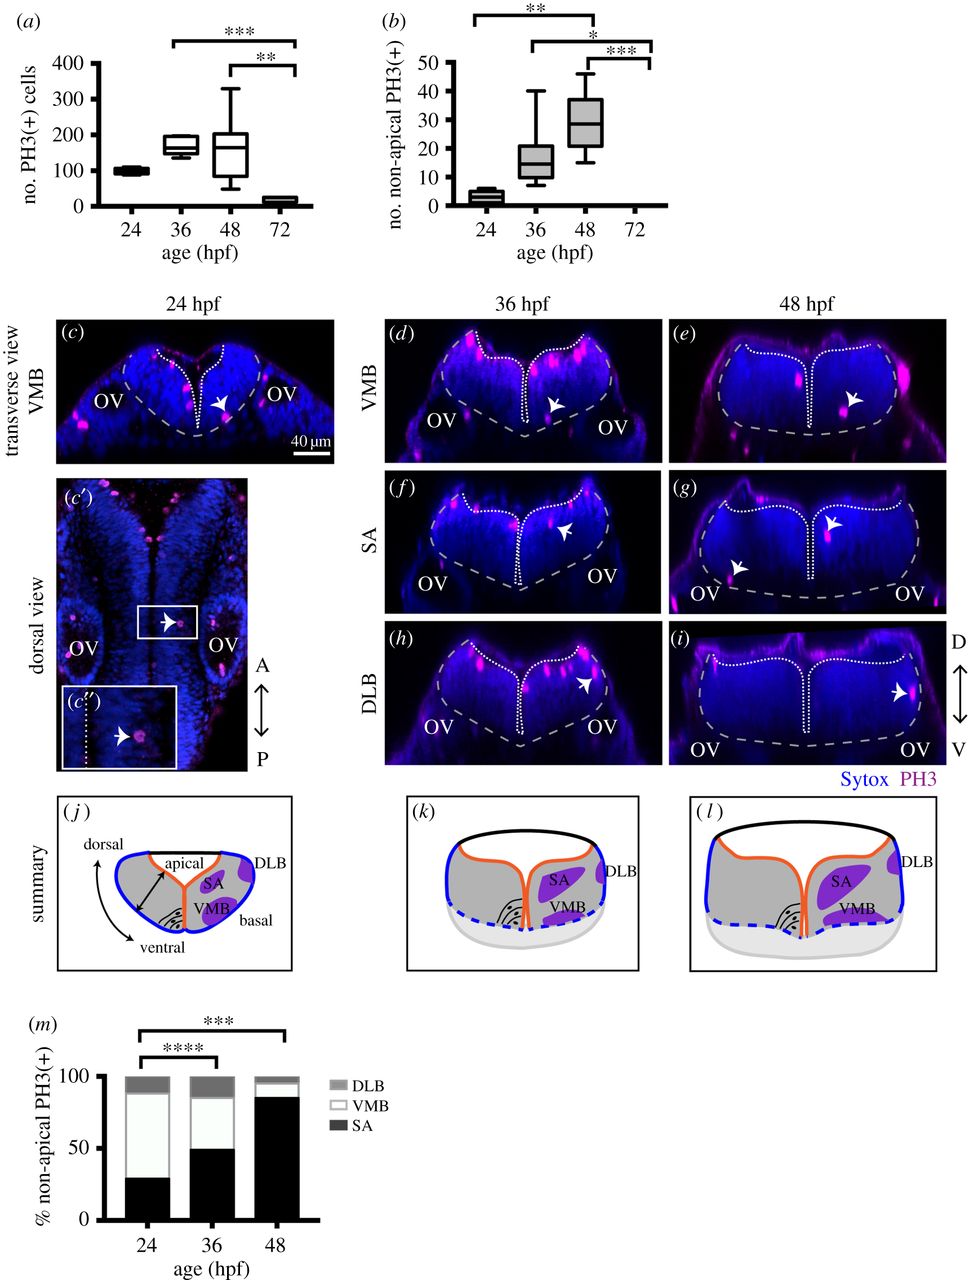
NAPs are restricted to specific regions in the developing hindbrain. (a) Quantification of all cells in mitosis in the zebrafish hindbrain at 24, 36, 48, 72 hpf. Data shown as a box-and-whisker plot with the line inside the box representing the mean and whiskers representing minimum and maximum values. The sample size is indicated in the text. Total number of cells in mitosis in the hindbrain (in apical and non-apical locations) decreases significantly at 72 hpf. Data analysed using Kruskal–Wallis (***p = 0.0006) with Dunn's multiple comparison test (**p = 0.0075, ***p = 0.0007). (b) Quantification of mitoses in non-apical locations in the zebrafish hindbrain at 24, 36, 48, 72 hpf. Data shown as a box-and-whisker plot with the line inside the box representing the mean and whiskers representing minimum and maximum values. The sample size is indicated in the text. The proportion of non-apical divisions in the hindbrain significantly increases between 24 and 48 hpf, but they are absent at 72 hpf. Data analysed using Kruskal–Wallis (****p < 0.0001) with Dunn's multiple comparison test (*p = 0.0124, **p = 0.0038,***p = 0.0002). (c–i) Neural progenitor mitoses revealed by PH3 staining (magenta, indicated by white arrows) in non-apical locations in zebrafish hindbrain at (c–c″) 24 hpf, (d,f,h) 36 hpf and (e,g,i) 48 hpf. Tissue is counterstained with nuclei marker (Sytox, in blue). (c′,c″) Single z-slice of a dorsal view of zebrafish hindbrain at low magnification; in (c′) a white arrow indicates an NAP mitosis, in (c″) higher magnification of white box in (c′). (c,d–i) Transverse optical sections of the zebrafish hindbrain show the position of NAP mitoses along the dorsoventral and mediolateral axis at (c–c″) 24 hpf, (d,f,h) 36 hpf and (e,g,i) 48 hpf. (c–i) At 24, 36 and 48 hpf NAP mitoses can occur in (c,d,e) ventral medial basal (VMB), (f,g) subapical (SA) and (h,i) dorsolateral basal (DLB) regions of the hindbrain neuroepithelium. Observations are summarized in (j–l). (m) The relative proportions of VMB, SA, DLB NAPs populations in the hindbrain at 24, 36 and 48 hpf are shown in the stacked bar diagram. Data analysed using a χ2 test (****p = 0.0001, ***p = 0.0006). In (c,c″,d–i) the basal and apical surfaces of the neuroepithelia are outlined by grey and white dashed lines respectively. OV, otic vesicle; A-P, antero-posterior; D-V, dorsoventral axis.