
|
Fig. 5
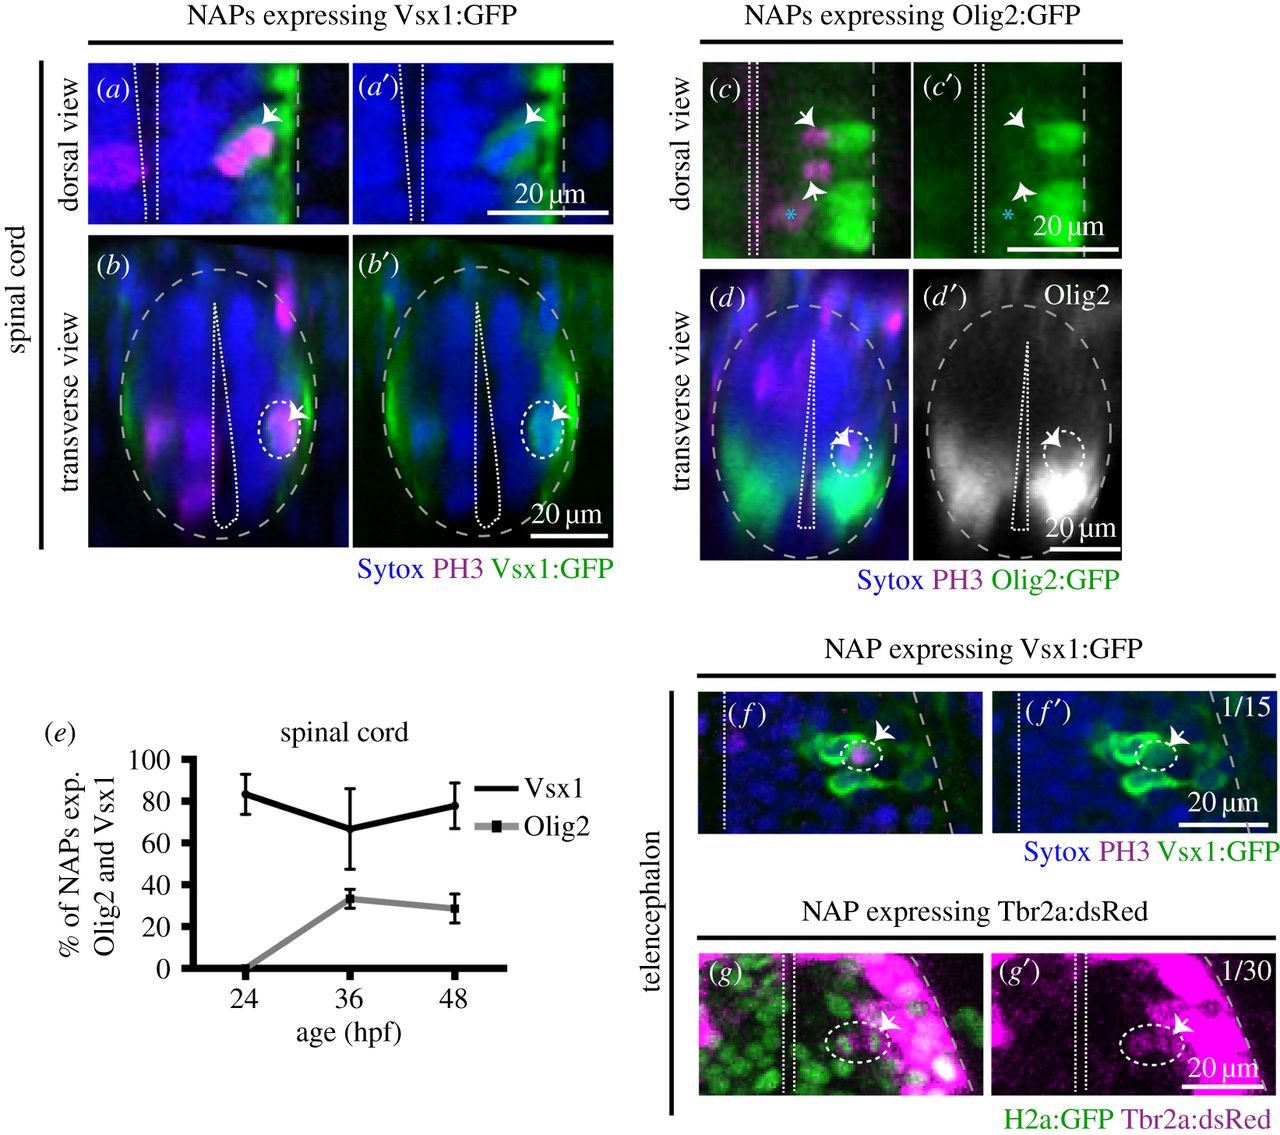
Vsx1, Olig2 and Tbr2 are expressed by subpopulations of NAPs in zebrafish spinal cord and telencephalon. (a,a′) Horizontal and (b,b′) transverse sections of spinal NAP in mitosis (white arrow) expressing Vsx1:GFP at 36 hpf. (c,c′) Horizontal and (d,d′) transverse section of spinal cord with a NAPs in mitosis (white arrow) expressing low levels of Olig2:GFP at 36 hpf. (e) Quantification of non-apical mitoses expressing Vsx1:GFP (black) or Olig2:GFP (grey) in spinal cord at 24, 36, 48 hpf. (f,f′) Single z-slice of NAP in mitosis (white arrow) expressing Vsx1:GFP in the telencephalon at 24 hpf. (g,g′) Single z-slice of NAP in mitosis (white arrow) expressing Tbr2a:dsRed in the telencephalon at 24 hpf. Green labels cell nuclei and magenta labels Tbr2 transgene. In (a–f′), magenta is PH3 staining and blue is Sytox nuclear counter stain. The grey and white dashed lines outline the basal and apical surfaces of the neuroepithelia, respectively.