
- Title
-
Transcriptional enhancement of Smn levels in motoneurons is crucial for proper axon morphology in zebrafish
- Authors
- Spiró, Z., Koh, A., Tay, S., See, K., Winkler, C.
- Source
- Full text @ Sci. Rep.
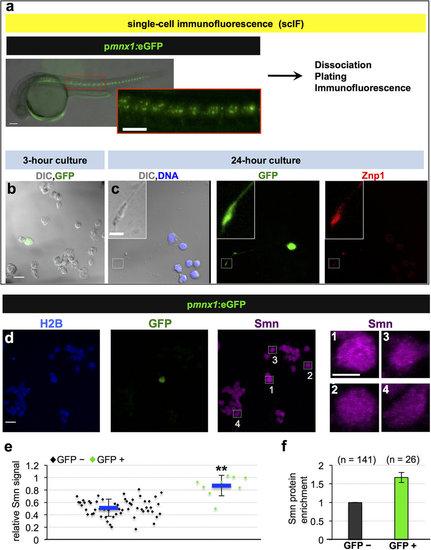
Motoneurons exhibit elevated Smn levels. (a-c) Single-cell immunofluorescent (scIF) experiments. 24 hpf pmnx1:eGFP embryos were dissociated and immunostained for Smn ((a) see also Methods). DIC image of cells following 3-hour (b) and 24-hour (c) incubation are shown with GFP in green. Note that the GFP signal in the cell body is oversaturated so that the weaker signal in the axon becomes visible. In (c) DNA is in blue and the motoneuron marker Znp1 (synaptotagmin) is in red; the axon growth cone is magnified in the corner of the images. Scale bars are 100 µm (a), 10 µm (low magnification in (b,c)) and 2 µm (high magnification in (c)). (d) scIF on pmnx1:eGFP embryos. Histone 2B (H2B), GFP and Smn signals are shown in Z-projected confocal sections. Cells marked by white rectangles are magnified on the right. Scale bars: 10 µm for low and 5 µm for high magnification. (e) To account for potential variability in the immunostaining, Smn levels were quantified relative to H2B. Diamonds denote GFP negative (GFP-) and GFP positive (GFP+) cells from one representative experiment. Blue bars indicate mean ± SD with significance values of *p < 0.05 and **p < 0.01. Exact values are (mean ± SD) 0.51 ± 0.14 (GFP-) and 0.87 ± 0.17 (GFP+), p = 0.001 with Wilcoxon Sum Rank Test. For more details, see Materials and Methods and Supplementary Table S1. (f) Average increase of Smn levels in motoneurons versus control cells. The exact value of enrichment is (mean ± SD): 1.67 ± 0.14. N = 3 experiments, n = number of analyzed cells. EXPRESSION / LABELING:
|
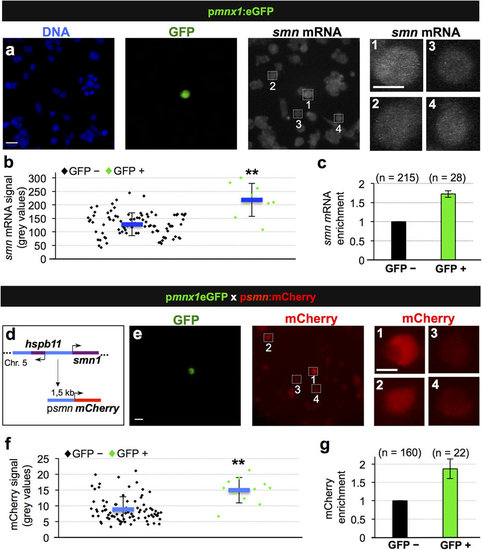
Transcriptional activation leads to increased Smn levels in motoneurons. (a) Single molecule FISH on pmnx1:eGFP embryos. DNA, GFP and smn mRNA signals are shown in Z-projected confocal sections. Scale bars: 10 µm for low and 5 µm for high magnification. (b) Quantification of smn mRNA signal from one representative experiment. Exact values are (mean ± SD): 127 ± 42 (GFP-) and 218 ± 61 (GFP+), p = 8.06 × 10⁻⁸ with Wilcoxon Sum Rank Test. (c) Average increase of smn mRNA levels in motoneurons versus control cells. The exact value of enrichment is 1.73 ± 0.09 (mean ± SD). N = 3 experiments, n = number of analyzed cells. (d) Putative smn promoter in zebrafish. Genomic situation (top) and mCherry construct (bottom). Arrows denote start of transcription. (e) scIF on pmnx1:eGFP × psmn:mCherry embryos. GFP and mCherry signals are shown. Scale bars: 10 µm for low and 5 µm for high magnification. (f) Quantification of mCherry signal from one representative experiment. Exact values are (mean ± SD): 8.9 ± 4 (GFP-) and 15 ± 4 (GFP+), p = 9.37 × 10⁻⁵ with Wilcoxon Sum Rank Test. (g) Average increase of mCherry levels in motoneurons versus control cells. The exact value of enrichment is 1.87 ± 0.27 (mean ± SD). N = 2 experiments, n = number of analyzed cells. |
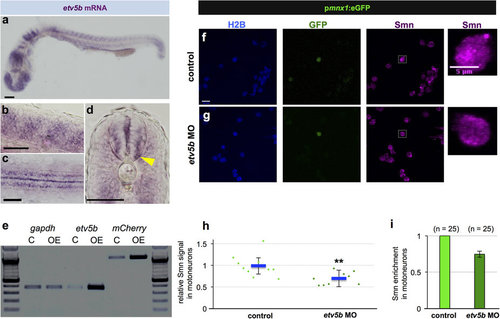
Etv5b activates the smn promoter leading to increased Smn levels in motoneurons. (a-d) Whole-mount in situ hybridization of etv5b expression in 24 hpf embryos. Expression pattern in the entire embryo (a), in magnified lateral (b) and dorsal (c) views as well as in a transverse section (d) of the trunk. In the latter case, yellow arrowhead denote signal in the motoneuron region. Scale bars: 100 µm (a) and 50 µm (b-d). nc, notochord. (e) RT-PCR in control (C - only psmn:mCherry) versus etv5b overexpressing (OE - etv5b mRNA and psmn:mCherry) embryos at early gastrula stage. (f,g) scIF of control (f) and etv5b MO (g) cells from pmnx1:eGFP embryos. H2B, GFP and Smn signals are shown in Z-projected confocal sections. GFP+ cells marked by white rectangles are magnified on the right. Scale bars: 10 µm for low and 5 µm for high magnification. (h) Relative Smn signal in control and in etv5b MO cells from one representative experiment. Exact values are (mean ± SD): 0.99 ± 0.25 (control) and 0.7 ± 0.14 (etvb5 MO), p = 0.003 with Wilcoxon Sum Rank Test. (i) Average relative Smn levels in control and in etv5b MO motoneurons. The exact value of decrease is 0.75 ± 0.04 (mean ± SD). N = 3 experiments, n = number of analyzed cells. EXPRESSION / LABELING:
|
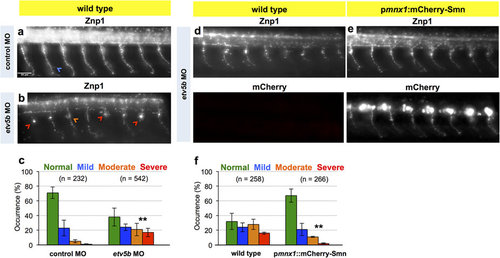
Knockdown of Etv5b results in axon defects due to motoneuronal reduction of Smn. (a,b) Z-projections of Znp1 stained motor axons on one side of an embryo after injection of control MO (a) and etv5b MO (b). Scale bar: 50 µm. Arrowheads mark different defects. (c) Quantification of axon defects. Normal, mild, moderate and severe axon morphology in control MO and etv5b MO injected embryos. N = 2 experiments (control MO, in total of 17 embryos) and 5 experiments (etv5b MO, in total of 42 embryos), n = number of axons analyzed. Significance is determined by comparing the occurrences of moderate and severe defects. Exact values in percentages of affected axons are (mean ± SD): 71 ± 7.8 (control MO, normal, 23 ± 10.6 (control MO, mild), 5 ± 2.1 (control MO, moderate), 1 ± 0.7 (control MO, severe), 38 ± 12.2 (etv5b MO, normal), 24 ± 4.4 (etv5b MO, mild), 21 ± 8.5 (etv5b MO, moderate) and 17 ± 5.8 (etv5b MO severe), p = 0.001 with unpaired Student’s t-test. (d,e) Z-projection of Znp1 stained motor axons on one side of control (d) and pmnx1:mCherry-Smn (e) embryos injected with etv5b MO. mCherry signal is shown below the Znp1 panel. (f) Quantification of axon morphology phenotypes in control and pmnx1:mCherry-Smn (mCh-S) embryos injected with etv5b MO. N = 3 experiments, n = number of axons analyzed in total of 22 (control MO) and 20 embryos (etv5b MO). Significance is determined by comparing the occurrences of moderate and severe defects. Exact values in percentages of affected axons are (mean ± SD): 32 ± 11.3 (control etv5b MO normal), 24 ± 5.9 (control etv5b MO mild), 28 ± 7 (control etv5b MO moderate), 16 ± 1.4 (control etv5b MO severe), 67 ± 9 (mCh-S etv5b MO normal), 21 ± 8.3 (mCh-S etv5b MO mild), 11 ± 0.8 (mCh-S etv5b MO moderate), 2 ± 0.9 (mCh-S etv5b MO severe), p = 0.009 with unpaired Student’s t-test. |
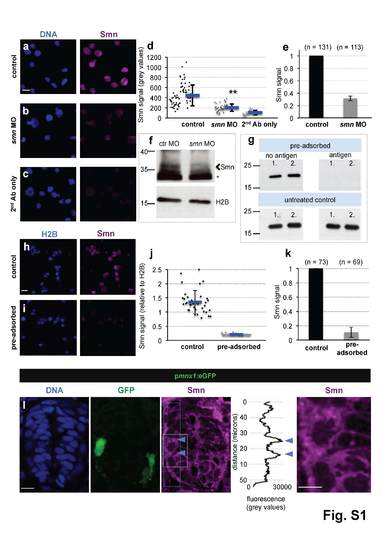
Addressing the specificity of the Smn antibody and motoneuronal Smn levels in vivo. a-c scIF of wild type (a) and smn MO (b) cells as well as of cells without primary Smn-antibody (c). DNA (blue) and Smn (purple) are shown. Scale bar: 10 µm. d Smn signal in control (black) and in smn MO (dark grey) cells as well as in cells without Smn-antibody (light grey) from a representative experiment. Exact values are (mean ± SD): 445 ± 206 (control), 204 ± 71 (smn MO) and 105 ± 44 (background), p = 2.95 × 10⁻¹³ with Wilcoxon Sum Rank Test. e Average relative Smn levels in control (black) and in smn MO (dark grey) cells. N = 2 experiments. , n = number of analyzed cells. Exact value of decrease is (mean ± SD): 0.32 ± 0.04. f Western blot analysis of Smn levels of control and of Smn MO-treated embryos. Arrowhead marks the band at the expected molecular weight of Smn (38 kDa), asterisk denotes an unspecific band. Histone 2B (H2B) was used as loading control. g Pre-adsorption performed with the purified N-terminal half of human SMN1. Following pre-adsorption, 100 ng of the N-terminal part of SMN1 was blotted in duplicates (1. and 2.) with control (‘no antigen’ on the column while pre-adsorbing, upper left image) or pre-adsorbed (‘antigen’, upper right image) antibody solution. The same membranes were blotted thereafter with untreated antibody proving the presence of SMN1 on the both membranes (lower images). h-i ScIF performed with control (h) and pre-adsorbed (i) antibodies in one representative experiment. Histone 2B (blue) and Smn (purple) are shown. Scale bar: 10 µm. j Smn levels relative to H2B of the pre-adsorption experiment shown in h and i. Exact values are (mean ± SD): 1.36 ± 0.4 (control), 0.22 ± 0.02 (pre-adsorbed), p = 1 × 10-13 with Wilcoxon Sum Rank Test. k Average relative Smn levels in control (black) and in pre-adsorbed (grey) cells. N = 2 experiments. , n = number of analyzed cells. Exact value of decrease is (mean ± SD): 0.11 ± 0.07. l Smn immunostaining on cryo-sectioned spinal cord from a 24 hpf pmnx1:eGFP embryo. Z-projection with DNA (blue), GFP (green) and Smn (purple) is shown. The blue dashed rectangle labels the area where a dorso-ventral intensity scan was performed with Image J, which is displayed next to the Smn image; blue arrows mark the location of the motoneuron. The area marked with white dashed rectangle on the Smn image is magnified on the very right. Several sections from seven embryos were analyzed; a representative section is shown. Scale bars are 10 µm and 5 µm. Of note, as motoneuron axons contain considerable amount of Smn, its levels in cell bodies are an underestimation of total Smn content, likely explaining why the enrichment is less clear in vivo compared with the ex vivo setup, where the axons are retracted. |
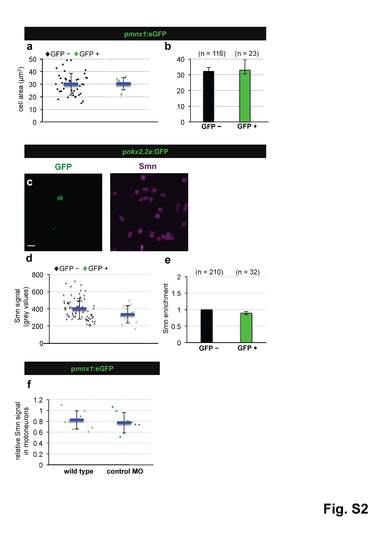
Smn levels are not higher in motoneurons due to a difference in cell size, are not elevated in perineurium cells and are not altered in motoneurons following control MO injection. a Cell area measurement in GFP negative (black diamonds) and GFP positive (green diamonds) cells of pmnx1:eGFP embryos from a representative experiment. The exact values are (mean ± SD): 30.4 µm2 ± 4.8 (GFP -) and 30.1µm2 ± 8.7 (GFP +), p = 0.48 with Wilcoxon Sum Rank Test. b Average cell size of GFP negative (black) and GFP positive (green) cells. N = 3 experiments. n = number of analyzed cells. Exact values are (mean ± SD): 32.3 µm2 ± 2.5 (GFP -) and 33 µm2 ± 6.5 (GFP +). c scIF on pnkx2.2a:GFP embryos. GFP and Smn signals are shown in Z-projected confocal sections. d Quantification of absolute Smn signal from a representative experiment. Exact values are (mean ± SD): 400 ± 122 (GFP -) and 335 ± 100 (GFP +), p=0.06 with Wilcoxon Sum Rank Test. e Ratio of Smn levels in perineurial cells (green) versus control cells (black). N = 3 experiments. n = number of analyzed cells. The exact value is (mean ± SD): 0.89 ± 0.05. f Quantification of scIF performed on pmnx1:eGFP embryos in wild type and in control MO cells. Exact values are (mean ± SD): 0.83 ± 0.17 (GFP -) and 0.78 ± 0.19 (GFP +), p=0.46 with Wilcoxon Sum Rank Test. |
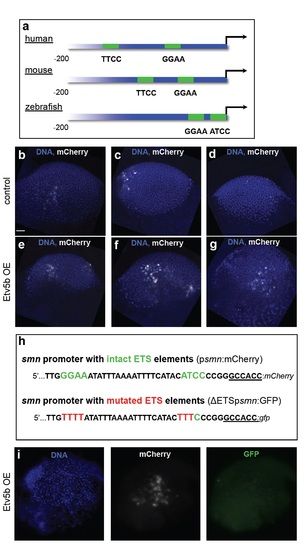
Evolutionary conservation of proximal ETS-binding sites in the smn promoter and overexpression and knock-down of etv5b. a The two proximal ETS binding sites (with consensus sites being GGAA/T or A/TTCC) shown in green in the human, murine and zebrafish smn promoters. Note that the binding sites in human and mouse are on the forward strands, while in zebrafish it is located in the reverse strand. The first 200 nucleotides upstream of the start codons are shown. b-g mCherry immunostaining (white) at the gastrula stage following psmn:mCherry injection without (b-d) or with Etv5b overexpression (e-g) on the same batch of embryos that was used for RT-PCR analysis shown in Fig. 3e. DNA is shown in blue. Scale bar: 100 microns. 8 embryos of control and 5 embryos with Etv5b overexpression were analyzed. h Schematic representation of the first 40 nucleotides of the smn promoter with intact (psmn:mCherry, top) and mutated (ΔETSpsmn:GFP, bottom) ETS elements used in the experiment in panel i. i A representative gastrula stage embryo that had been co-injected with Etv5b mRNA, the psmn:mCherry plasmid as well as the ΔETSpsmn:GFP plasmid and immunostained against mCherry and GFP. DNA is shown in blue. 5 embryos showing strong mCherry staining were analyzed. |