
|
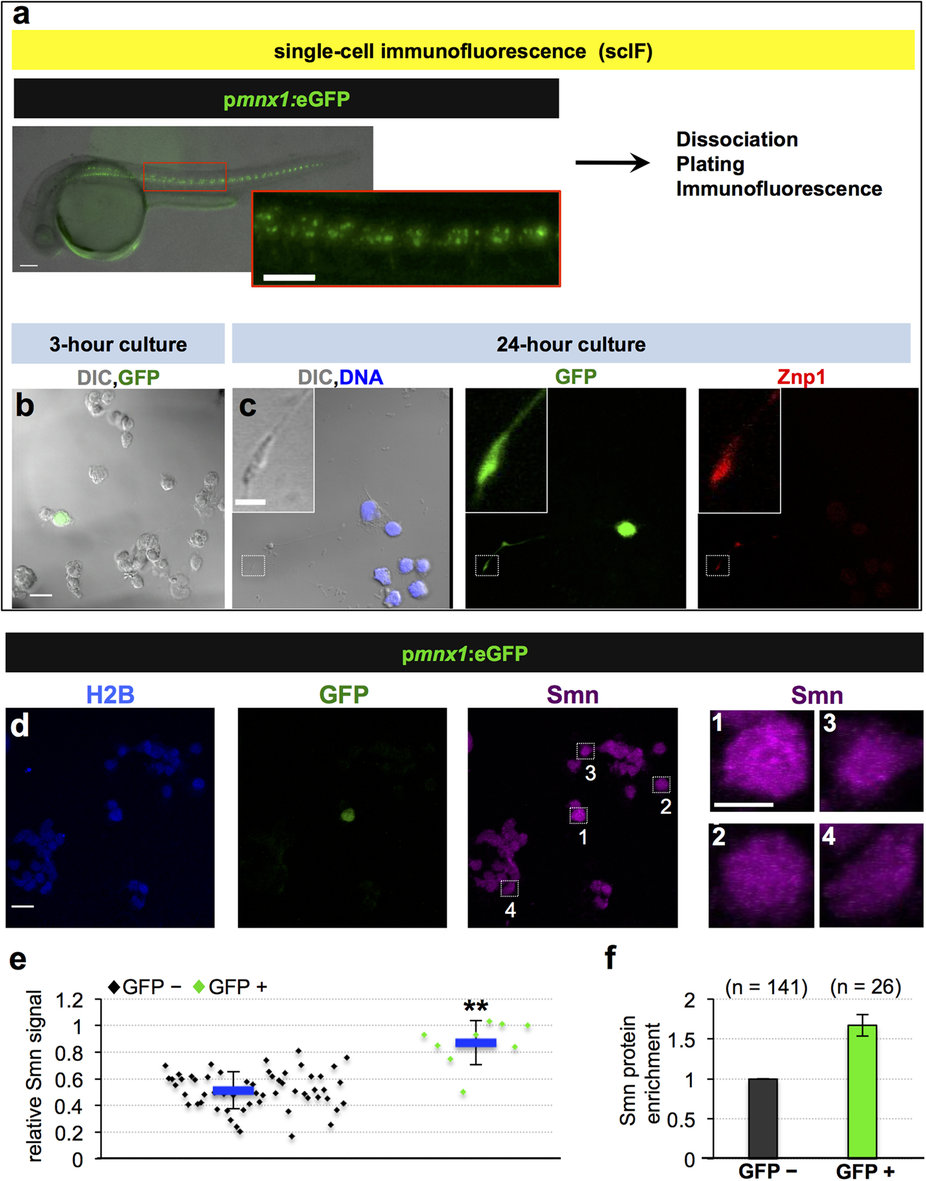
Fig. 1
Motoneurons exhibit elevated Smn levels. (a-c) Single-cell immunofluorescent (scIF) experiments. 24 hpf pmnx1:eGFP embryos were dissociated and immunostained for Smn ((a) see also Methods). DIC image of cells following 3-hour (b) and 24-hour (c) incubation are shown with GFP in green. Note that the GFP signal in the cell body is oversaturated so that the weaker signal in the axon becomes visible. In (c) DNA is in blue and the motoneuron marker Znp1 (synaptotagmin) is in red; the axon growth cone is magnified in the corner of the images. Scale bars are 100 µm (a), 10 µm (low magnification in (b,c)) and 2 µm (high magnification in (c)). (d) scIF on pmnx1:eGFP embryos. Histone 2B (H2B), GFP and Smn signals are shown in Z-projected confocal sections. Cells marked by white rectangles are magnified on the right. Scale bars: 10 µm for low and 5 µm for high magnification. (e) To account for potential variability in the immunostaining, Smn levels were quantified relative to H2B. Diamonds denote GFP negative (GFP-) and GFP positive (GFP+) cells from one representative experiment. Blue bars indicate mean ± SD with significance values of *p < 0.05 and **p < 0.01. Exact values are (mean ± SD) 0.51 ± 0.14 (GFP-) and 0.87 ± 0.17 (GFP+), p = 0.001 with Wilcoxon Sum Rank Test. For more details, see Materials and Methods and Supplementary Table S1. (f) Average increase of Smn levels in motoneurons versus control cells. The exact value of enrichment is (mean ± SD): 1.67 ± 0.14. N = 3 experiments, n = number of analyzed cells.