
|
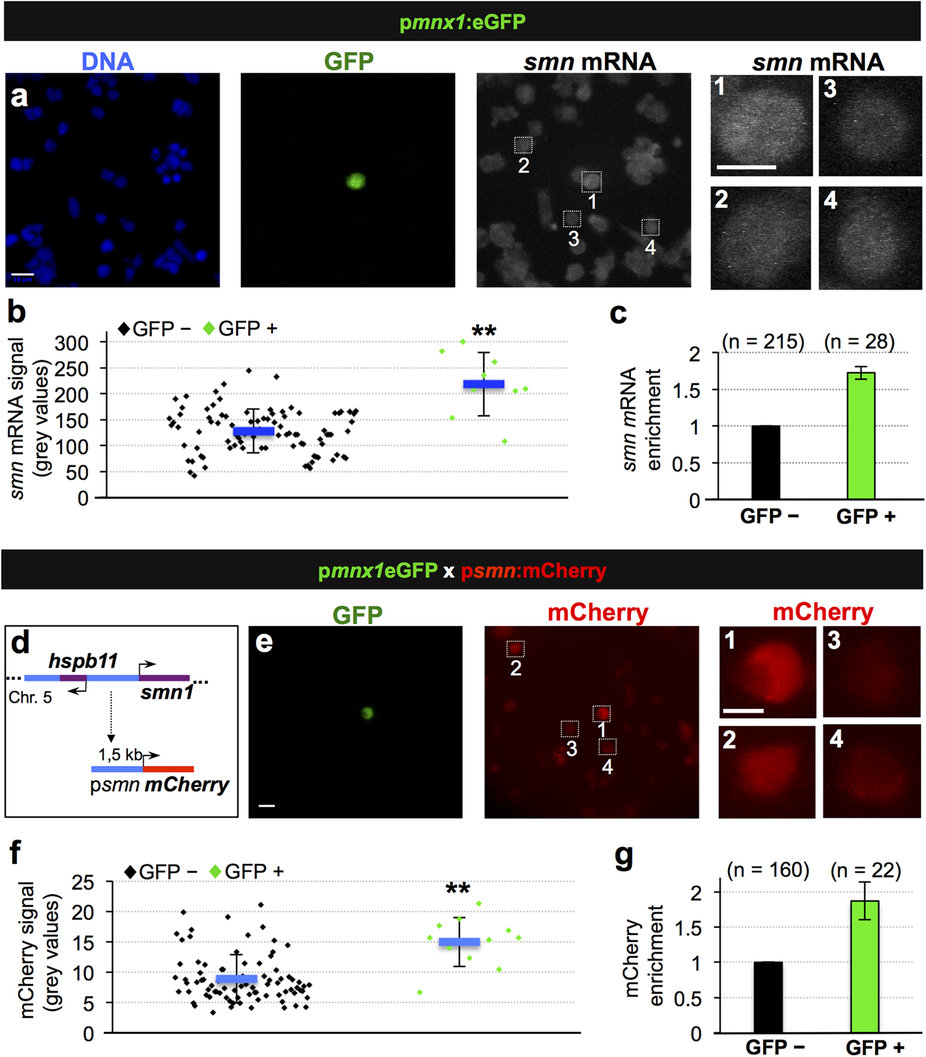
Fig. 2
Transcriptional activation leads to increased Smn levels in motoneurons. (a) Single molecule FISH on pmnx1:eGFP embryos. DNA, GFP and smn mRNA signals are shown in Z-projected confocal sections. Scale bars: 10 µm for low and 5 µm for high magnification. (b) Quantification of smn mRNA signal from one representative experiment. Exact values are (mean ± SD): 127 ± 42 (GFP-) and 218 ± 61 (GFP+), p = 8.06 × 10⁻⁸ with Wilcoxon Sum Rank Test. (c) Average increase of smn mRNA levels in motoneurons versus control cells. The exact value of enrichment is 1.73 ± 0.09 (mean ± SD). N = 3 experiments, n = number of analyzed cells. (d) Putative smn promoter in zebrafish. Genomic situation (top) and mCherry construct (bottom). Arrows denote start of transcription. (e) scIF on pmnx1:eGFP × psmn:mCherry embryos. GFP and mCherry signals are shown. Scale bars: 10 µm for low and 5 µm for high magnification. (f) Quantification of mCherry signal from one representative experiment. Exact values are (mean ± SD): 8.9 ± 4 (GFP-) and 15 ± 4 (GFP+), p = 9.37 × 10⁻⁵ with Wilcoxon Sum Rank Test. (g) Average increase of mCherry levels in motoneurons versus control cells. The exact value of enrichment is 1.87 ± 0.27 (mean ± SD). N = 2 experiments, n = number of analyzed cells.