
|
Fig. S1
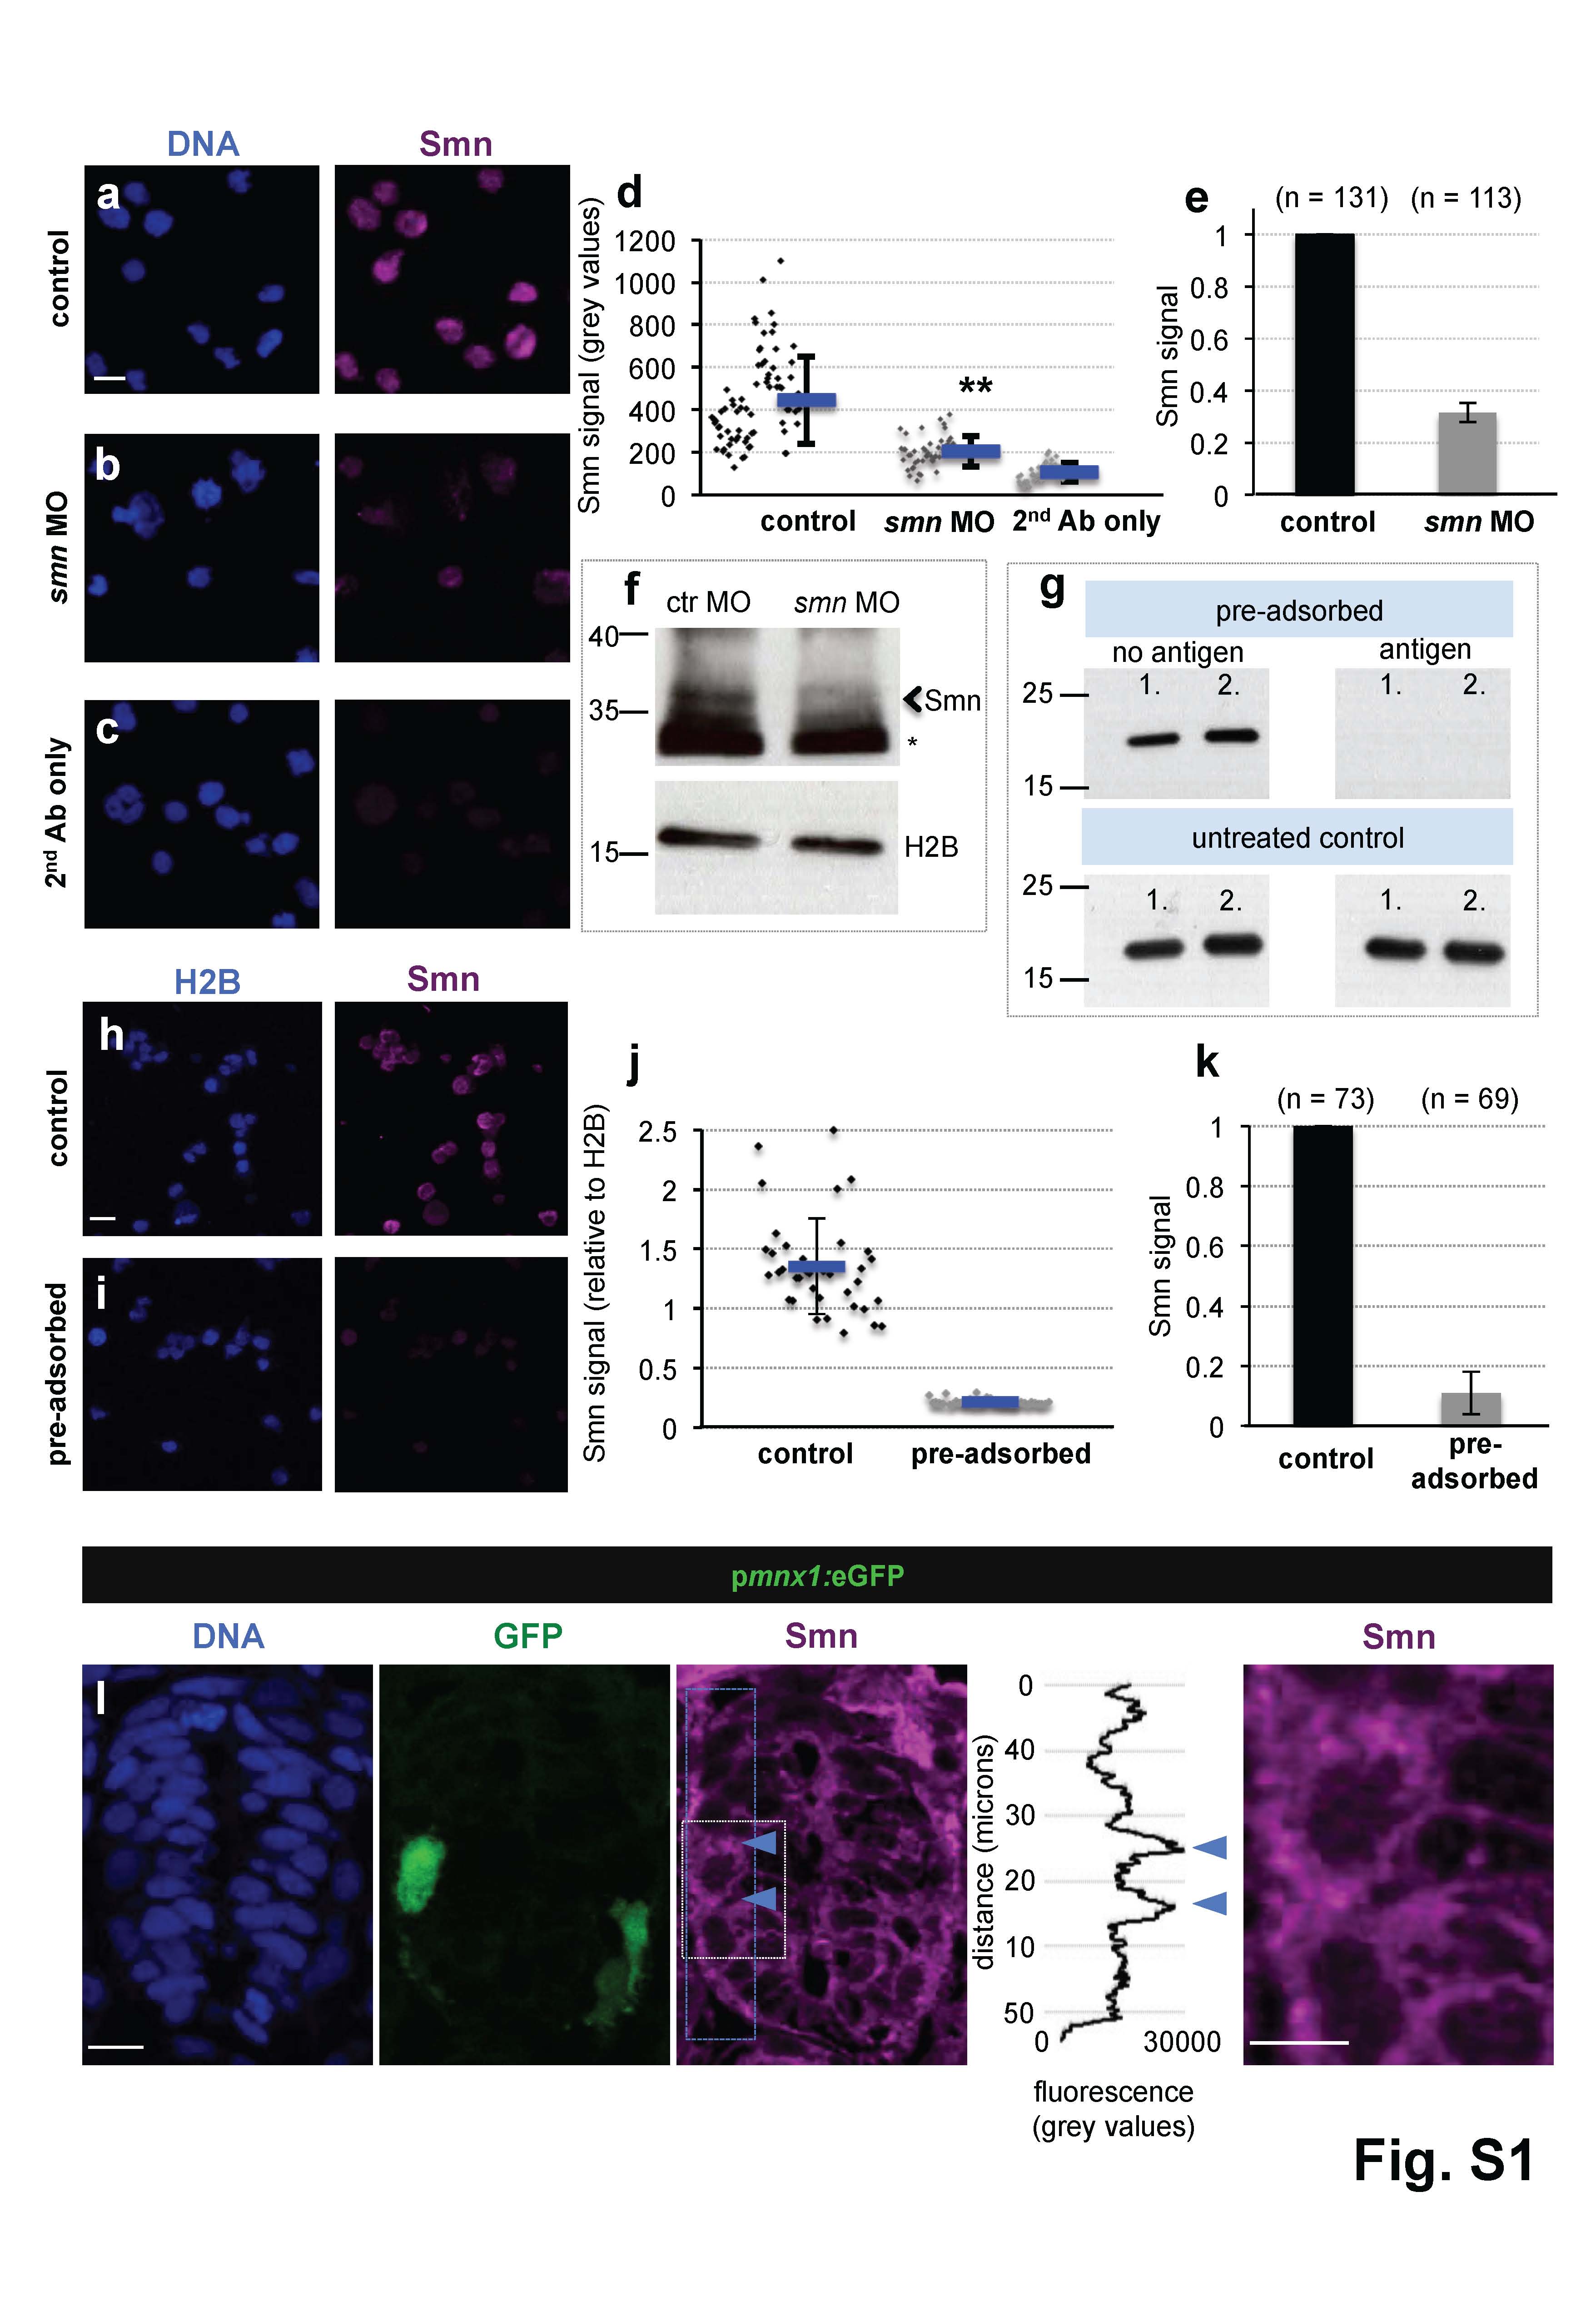
Addressing the specificity of the Smn antibody and motoneuronal Smn levels in vivo.
a-c scIF of wild type (a) and smn MO (b) cells as well as of cells without primary Smn-antibody (c). DNA (blue) and Smn (purple) are shown. Scale bar: 10 µm.
d Smn signal in control (black) and in smn MO (dark grey) cells as well as in cells without Smn-antibody (light grey) from a representative experiment. Exact values are (mean ± SD): 445 ± 206 (control), 204 ± 71 (smn MO) and 105 ± 44 (background), p = 2.95 × 10⁻¹³ with Wilcoxon Sum Rank Test.
e Average relative Smn levels in control (black) and in smn MO (dark grey) cells. N = 2 experiments. , n = number of analyzed cells. Exact value of decrease is (mean ± SD): 0.32 ± 0.04.
f Western blot analysis of Smn levels of control and of Smn MO-treated embryos. Arrowhead marks the band at the expected molecular weight of Smn (38 kDa), asterisk denotes an unspecific band. Histone 2B (H2B) was used as loading control.
g Pre-adsorption performed with the purified N-terminal half of human SMN1. Following pre-adsorption, 100 ng of the N-terminal part of SMN1 was blotted in duplicates (1. and 2.) with control (‘no antigen’ on the column while pre-adsorbing, upper left image) or pre-adsorbed (‘antigen’, upper right image) antibody solution. The same membranes were blotted thereafter with untreated antibody proving the presence of SMN1 on the both membranes (lower images).
h-i ScIF performed with control (h) and pre-adsorbed (i) antibodies in one representative experiment. Histone 2B (blue) and Smn (purple) are shown. Scale bar: 10 µm.
j Smn levels relative to H2B of the pre-adsorption experiment shown in h and i. Exact values are (mean ± SD): 1.36 ± 0.4 (control), 0.22 ± 0.02 (pre-adsorbed), p = 1 × 10-13 with Wilcoxon Sum Rank Test.
k Average relative Smn levels in control (black) and in pre-adsorbed (grey) cells. N = 2 experiments. , n = number of analyzed cells. Exact value of decrease is (mean ± SD): 0.11 ± 0.07.
l Smn immunostaining on cryo-sectioned spinal cord from a 24 hpf pmnx1:eGFP embryo. Z-projection with DNA (blue), GFP (green) and Smn (purple) is shown. The blue dashed rectangle labels the area where a dorso-ventral intensity scan was performed with Image J, which is displayed next to the Smn image; blue arrows mark the location of the motoneuron. The area marked with white dashed rectangle on the Smn image is magnified on the very right. Several sections from seven embryos were analyzed; a representative section is shown. Scale bars are 10 µm and 5 µm. Of note, as motoneuron axons contain considerable amount of Smn, its levels in cell bodies are an underestimation of total Smn content, likely explaining why the enrichment is less clear in vivo compared with the ex vivo setup, where the axons are retracted.