
- Title
-
Zebrafish Caudal Fin Angiogenesis Assay-Advanced Quantitative Assessment Including 3-Way Correlative Microscopy
- Authors
- Hlushchuk, R., Brönnimann, D., Correa Shokiche, C., Schaad, L., Triet, R., Jazwinska, A., Tschanz, S.A., Djonov, V.
- Source
- Full text @ PLoS One
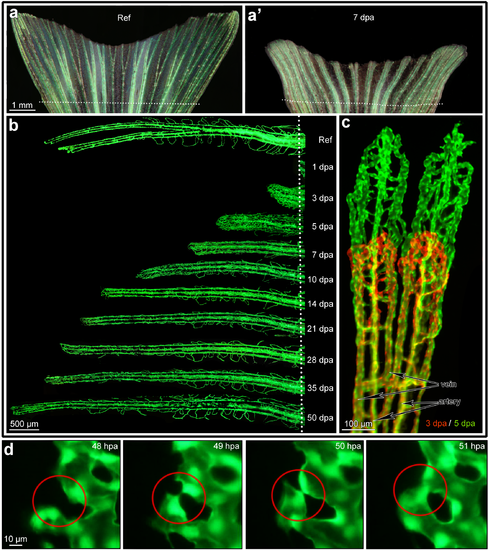
In vivo monitoring of the angiogenic process during fin regeneration. Panel "a" displays the reference image of caudal fin (just before amputation) taken with both normal bright and fluorescent reflected light. The vessels appear green (eGFP in Tie-2 positive endothelial cells). Panel "a' " displays a representative image of the regenerated caudal fin at 7 dpa (days post amputation). The dotted line indicates the amputation level. Panel "b" displays the vascular regeneration process at higher resolution at example of one fin ray. Starting from 10 dpa the vasculature starts to resemble the reference vascular pattern before amputation (Ref). The red-green image in panel "c" demonstrates the outgrowth of the vasculature between 3 dpa (red) and 5dpa (green): one can easily follow the formation of every single vessel segment in dynamics. Arteries situated in the central part (core) of the ray (one per ray) can be clearly distinguished from the veins (2 per ray) situated aside from the ray core (see markings in c). Panel "d": high resolution in vivo time lapse images demonstrating the fate of single capillary sprouts within 4 hours. Left image shows the vessels at 48 hours post amputation (hpa), already one hour later opposing sprouting tips are approaching each other. By 50 hpa, the opposing vessel walls seem to be already attached. At 51 hpa the new vascular segment is formed and already perfused. Endothelial cell nuclei are fluorescing intensive green. |
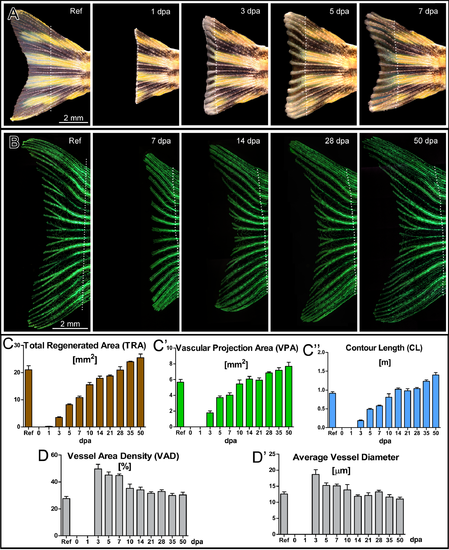
Regeneration of the zebrafish caudal fin and time courses of total regenerated area (TRA), vascular projection area (VPA), vessel wall (contour) length (CL) and their derivatives during regeneration. The process of caudal fin regeneration at multiple time points from reference to 50 dpa: the upper row (A) represents bright field images at reference, 1, 3, 5, and 7 dpa. The second row (B) contains fluorescent images at reference, 7, 14, 28, and 50 dpa. Such images allowed quantitative assessment of time courses of multiple general and vascular parameters as presented in the graphs C-C'', D and D'. At least 50% of the cut fin (TRA) is regenerated within the first 7 days (C) and the rapid angiogenesis between day 3 and 7 leads to increase of the vessel area values almost up to the reference level (C'). The levels of contour length reached reference level at 10–14 dpa. Vessel area density (D) as well as average vessel diameter (D') were remarkably higher in comparison with the reference up to 7 dpa. |
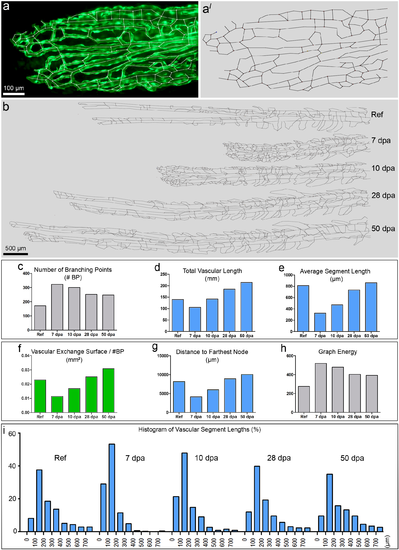
Skeletonization of the vasculature of the 4th fin ray and its quantification. a displays the distal vasculature of the 4th fin ray with overlaid skeleton. a' displays the same skeleton without the original image. b represents the skeletons of regenerated parts of the same 4th ray at different time points (reference, 7, 10, 28 and 50 dpa). The graphs in c-i display dynamics of the parameters used for quantitative analysis of the skeletons at different time points: number of branching points (c), total vascular length (d), average segment length (e), and vascular exchange surface per branching point (f), distance to farthest node (g), graph energy (h). The histograms in i showed a clear left shift at 7 dpa and 10 dpa due to the higher number of branching points and respectively shorter vascular segment lengths. |
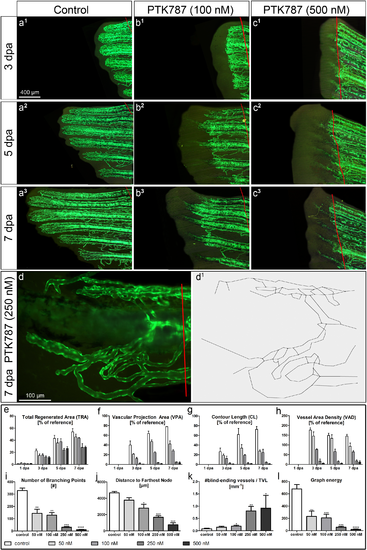
DAA: Assessment of the anti-angiogenic effects of PTK787 at different concentrations 50, 100, 250, 500 nM: a-c Fluorescent images of regenerating caudal fins at 3 (a1-c1), 5 (a2-c2) and 7 dpa (a3-c3) under 3 different conditions: vehicle control (left column), 100 nM (middle) and 500 nM PTK787 (right column). PTK787 clearly inhibits regenerative vascular outgrowth in a dose-dependent manner as confirmed by the quantitative assessment (see graphs e-l). Based on the high-magnification images of the single fin rays at 7 dpa (example in d), the skeletons of the regenerating vasculature were obtained (d1). Advanced analysis of the vasculature of the 4th ray at 7 dpa allows quantitative differentiation between multiple concentrations of PTK787. Although tissue regeneration was remarkably inhibited at 5 and 7 dpa at 250 and 500 nM (c2, c3 and e): at 50 and 100 nM of PTK787—no such prominent effects were observed (b2, b3 and e). VPA (f), CL (g) and VAD (h) showed dose-dependent inhibition with the difference between two lowest concentrations decreasing towards day 7. Four advanced (skeleton-based) parameters are presented in the lower row of graphs (i-l). Number of BPs (i) clearly distinguishes between lower and higher concentrations of PTK787, with the distance to the farthest node (j) being most informative/reliable for differentiation between all four concentrations applied. The number of blind-ending vascular segments per total vascular length (k) turned out to be capable of distinguishing the 4 concentrations applied. Interestingly, the newly introduced parameter graph energy (l) describing the connectivity of the vascular network detected highly significant differences between all the applied concentrations and the reference. *—p<0.05; **—p<0.01; ***—p<0.001; ****—p<0.0001. |
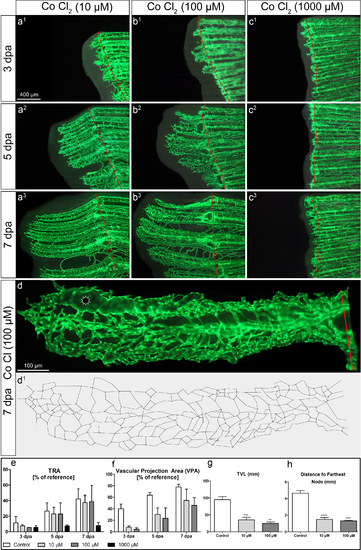
Assessment of effects of systemic cobalt chloride application at different concentrations 10, 100 and 1000μM. a-c Fluorescent images of regenerating caudal fins at 3 (a1-c1), 5 (a2-c2) and 7 dpa (a3-c3) under 3 different conditions: 10 μM (left column), 100 μM (middle) and 1000 μM of cobalt chloride (right column). Based on the high-magnification images of the single fin rays at 7 dpa (d), the skeletons of the regenerating vasculature at 7dpa were obtained (d’). The commonly used assessment values revealed no statistically significant differences (e-f). To focus on the effects of CoCl2-treatment in all applied concentrations, the controls are not displayed in this figure. The control fish used for the quantifications shown in the graphs (e-h) are the same as in Fig 4. TRA in 10- and 100 μM groups had no remarkable difference in comparison with the control values (e). At 7dpa, the vascular projection area could reveal some tendency to dose-dependent inhibition, but the difference was not statistically significant. That can be, at least, partially explained by the sporadic presence of dilated vessels (marked with an asterisk in d). The skeleton-derived parameters like total vascular length (TVL) (g) or distance to farthest node (h) are not influenced by dilated vessels and revealed statistically significant differences. *—p<0.05; **—p<0.01; ***—p<0.001; ****—p<0.0001. Remark: The mortality in the 1000μM-group was very high (only 2 out of 8 fishes survived till day 7)–that was the reason for not considering it for the advanced analysis. |
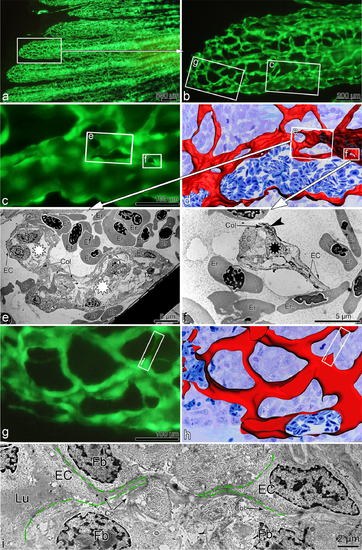
Correlative microscopy: Correlation of vascular alterations in vivo to their morphological substrate. in vivo. The in vivo fluorescent image in a shows the regenerating fin vasculature (5 dpa) at low magnification. b, c and g zoom in the site of interest indicated by rectangles. Based on serial semithin sections, panels d and h display the 3D-reconstruction of the areas depicted in c and g respectively. c-f: proximal region of interest, mainly characterized by transluminal tissue pillars and meshes (sign of intussusceptive angiogenesis). Transmission electron micrographs in e & f demonstrate the pillars at ultrastructural level. Black asterisk (also smallest frame in c and d) indicates transluminal tissue pillars, while white asterisks show inter-capillary meshes (large pillars). One can also detect the cell-cell contacts in between the endothelial cells (dark area indicated with an arrowhead in f). g-i: distal region with predominant sprouting mode of angiogenesis. Frames in g & h mark the sprout formation presented at ultrastructural level in i. Dashed green lines in i indicate the borders of fusing sprouts coming from opposing endothelial cells (EC): the sprouts are progressing along the collagen scaffolds. Er = erythrocyte, Col = collagen fibers, Fb = fibroblast, EC = endothelial cell, Lu–vessel lumen. |
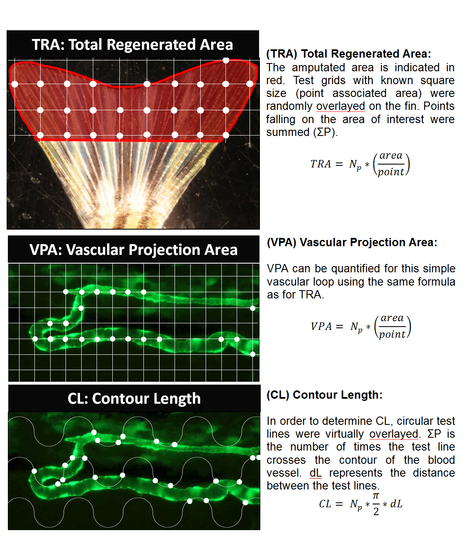
Stereology (TRA) Total Regenerated Area: The amputated area is indicated in red. Test grids with known square size (point associated area) were randomly overlayed on the fin. Points falling on the area of interest were summed (ΣP). TRA= Np*(area/point) (VPA) Vascular Projection Area: VPA can be quantified for this simple vascular loop using the same formula as for TRA. VPA= Np*(area/point) (CL) Contour Length: In order to determine CL, circular test lines were virtually overlayed. ΣP is the number of times the test line crosses the contour of the blood vessel. dL represents the distance between the test lines. CL= Np*π/2*dL |
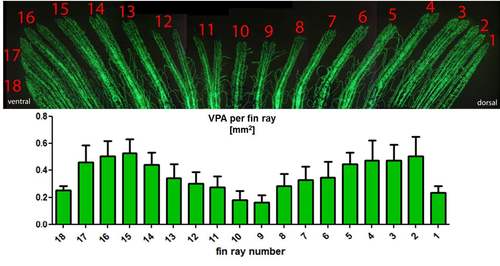
Identification and quantification of individual fin rays (n = 7) Stereology allowed quantification of absolute values for various parameters from individual fin rays. This can be very important to reduce the area of interest to specific sites. In this example, the fin rays were numbered from dorsal to the ventral aspect. |