
Fig. 6
- ID
- ZDB-FIG-171110-4
- Publication
- Hlushchuk et al., 2016 - Zebrafish Caudal Fin Angiogenesis Assay-Advanced Quantitative Assessment Including 3-Way Correlative Microscopy
- Other Figures
- All Figure Page
- Back to All Figure Page
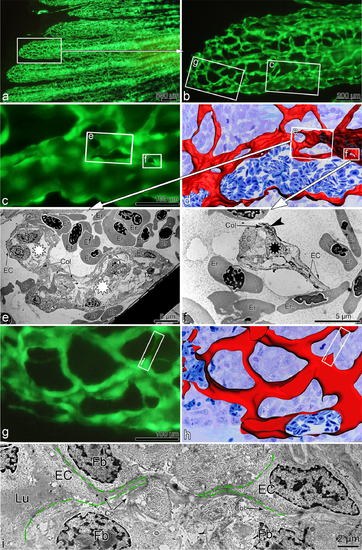
Correlative microscopy: Correlation of vascular alterations in vivo to their morphological substrate. in vivo. The in vivo fluorescent image in a shows the regenerating fin vasculature (5 dpa) at low magnification. b, c and g zoom in the site of interest indicated by rectangles. Based on serial semithin sections, panels d and h display the 3D-reconstruction of the areas depicted in c and g respectively. c-f: proximal region of interest, mainly characterized by transluminal tissue pillars and meshes (sign of intussusceptive angiogenesis). Transmission electron micrographs in e & f demonstrate the pillars at ultrastructural level. Black asterisk (also smallest frame in c and d) indicates transluminal tissue pillars, while white asterisks show inter-capillary meshes (large pillars). One can also detect the cell-cell contacts in between the endothelial cells (dark area indicated with an arrowhead in f). g-i: distal region with predominant sprouting mode of angiogenesis. Frames in g & h mark the sprout formation presented at ultrastructural level in i. Dashed green lines in i indicate the borders of fusing sprouts coming from opposing endothelial cells (EC): the sprouts are progressing along the collagen scaffolds. Er = erythrocyte, Col = collagen fibers, Fb = fibroblast, EC = endothelial cell, Lu–vessel lumen. |