
- Title
-
Hypothalamic radial glia function as self-renewing neural progenitors in the absence of Wnt/ß-catenin signaling
- Authors
- Duncan, R.N., Xie, Y., McPherson, A.D., Taibi, A.V., Bonkowsky, J.L., Douglass, A.D., Dorsky, R.I.
- Source
- Full text @ Development
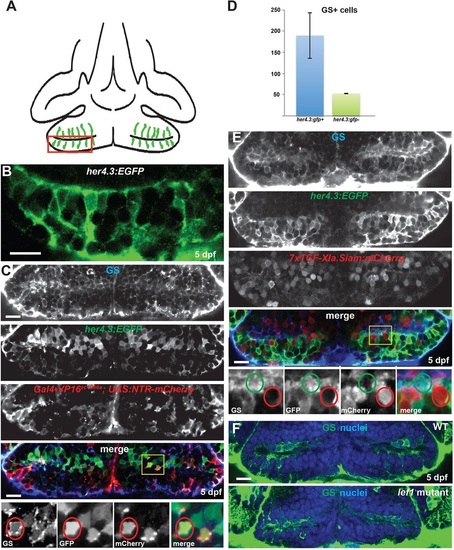
Radial glia in the hypothalamic posterior recess are not Wnt-responsive. (A) Diagram of the hypothalamic posterior recess from a ventral view of a 5dpf zebrafish brain. Radial glia are in green; the red box indicates the area depicted in B. (B) High-magnification optical section of her4.3:EGFP expression, showing the position of cell soma and radial processes. (C) Radial glial cells in the 5dpf posterior recess can be labeled with anti-Glutamine synthetase (GS, blue), a her4.3:EGFP transgene (green), and a Gal4 enhancer trap line (red). Yellow box indicates the region shown beneath. A triple-labeled cell is indicated by red circles. (D) Most cells expressing GS or her4.3:EGFP also express the other marker. Error bars indicate s.e.m.; n=22 optical sections from two brains. (E) Most GS+ and her4.3:EGFP+ radial glia do not express the Wnt reporter transgene 7xTCF-Xla.Siam:GFP. Yellow box indicates region shown beneath. A reporter-negative radial glial cell is indicated by green circles, and a reporter-expressing non-glial cell is indicated by red circles. (F) GS+ cells are not reduced in number in lef1 mutants at 5dpf. Images are single optical sections from ventral views of whole-mount brains. WT, wild type; nuclei are stained with Hoechst 33342 (blue). Scale bars: 10µm. |
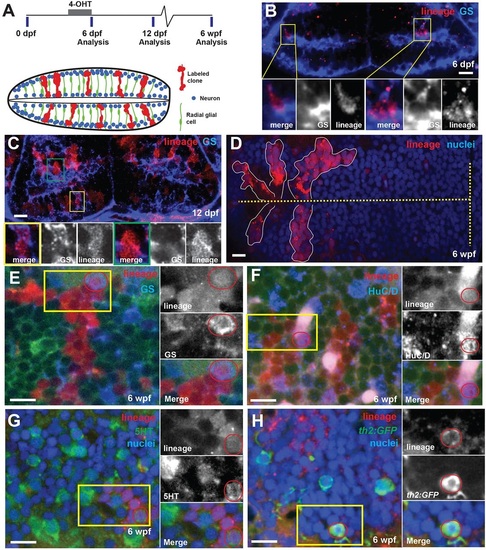
Hypothalamic radial glia are self-renewing neural progenitors. (A) Timeline and schematic of experiments. Cells expressing 3her4.1:ERT2-Cre-ERT and ubi:loxP-eGFP-loxP-mCherry were genetically labeled by the addition of 5µM 4-OHT from 5-6dpf. Labeled progeny (red) comprise expanding radial units spanning hemispheres of the posterior recess. Processes of GS+ radial glia (green) span the tissue, and nuclei occupy variable positions from the ventricle to the outer edge. Neurons (blue) are located either adjacent to the ventricle or at the outer edge. (B) Immediately following conversion, the few labeled mCherry+ cells are also GS+. Yellow boxes indicate regions shown beneath. (C) Six days after conversion, labeled cells extend radially and include GS+ (yellow box) and GS (green box) cells. (D) Five weeks after 4-OHT addition, discrete groups of mCherry+ cells extend from the ventricle (dashed line). (E-H) mCherry+ progeny 5weeks after recombination include GS+ radial glia (E), HuC/D+ neurons (F), 5HT+ neurons (G) and th2:gfp+ dopaminergic neurons (H). Yellow boxes indicate regions shown beneath, and double-labeled cells are indicated by red circles. Green signal in E,F is ubi:GFP from unconverted cells. Images are single optical sections from ventral views of whole-mount brains. Scale bars: 10µm. |
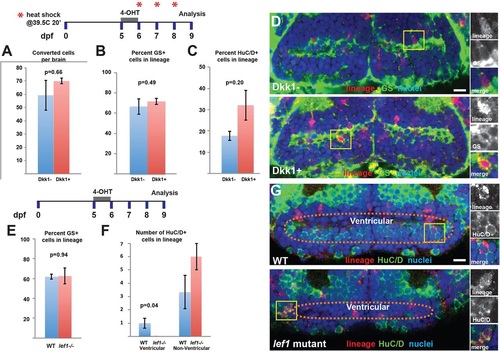
Wnt/β-catenin signaling is only required for the differentiation of a specific subset of ventricular neurons. (A,B) Following recombination of 3her4.1:ERT2-Cre-ERT+ progeny from 5-6dpf, expression of Dkk1 from 6-9dpf does not affect the average number of labeled cells (A) or the percentage of GS+ cells (B) in the lineage. (C) The differentiation of HuC/D+ neurons from labeled radial glia is not inhibited by Dkk1 expression. (D) Representative images of labeling for lineage and GS in control and Dkk1-expressing larvae. (E) In lef1 mutants there is no change in the percentage of GS+ cells after conversion from 5-6dpf and analysis at 9dpf. (F,G) lef1-dependent ventricular neurons fail to arise from the radial glial lineage, whereas other non-ventricular neurons are not significantly affected. Yellow boxes indicate areas shown to the right. Images are single optical sections from ventral views of whole-mount brains. Error bars indicate s.e.m.; n=50 confocal slices from five brains for each experiment. Scale bars: 10µm. |
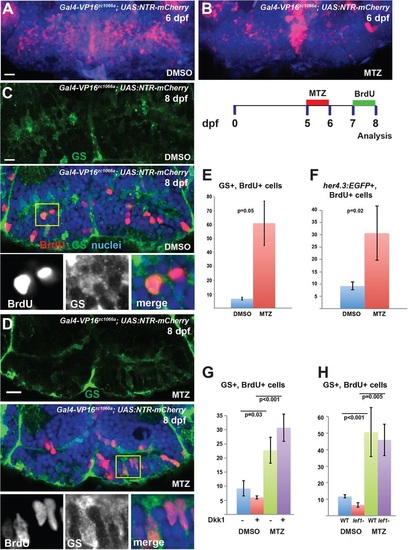
Hypothalamic radial glia respond to partial ablation by increasing proliferative activity. (A,B) Partial ablation of NTR-mCherry-expressing radial glia (red) by incubation in 1mM MTZ from 5-6dpf; DMSO provides a control. (C-F) After partial ablation from 5-6dpf and BrdU labeling from 7-8dpf (C,D; yellow box indicates region shown beneath), there is a significant increase in the number of BrdU+ radial glia labeled either by GS (C-E) or by her4.3:EGFP (F) expression. (G,H) Inhibition of Wnt signaling by Dkk1 expression (G), or lef1 mutation (H), does not block the increase in BrdU labeling following partial ablation. Images are maximum-intensity z-projections (A,B) or single optical sections (C,D) from ventral views of whole-mount brains. Error bars indicate s.e.m.; n=40 optical sections from four brains for each experiment. Scale bars: 10µm. |
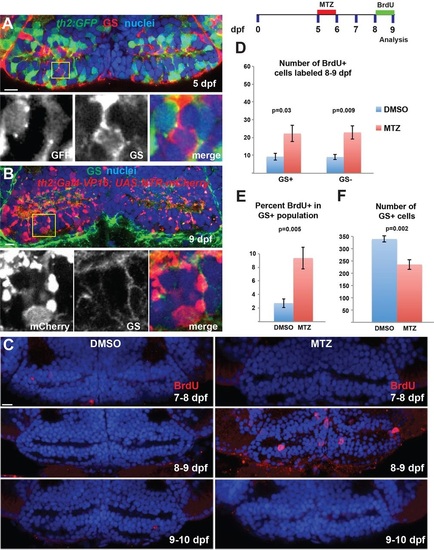
Hypothalamic radial glia proliferate in response to ablation of dopaminergic progeny. (A,B) The th2:GFP (5dpf, A) and th2:Gal4 (9dpf, B) transgenes do not label GS+ radial glia. Yellow boxes indicate regions shown beneath. (C) Ablation of th2:Gal4+ cells from 5-6dpf leads to increased BrdU labeling only at 8-9dpf. (D,E) Ablation of th2:Gal4+ cells increases the number and percentage of GS+ radial glia, as well as the number of GS cells, labeled with BrdU from 8-9dpf. (F) The overall number of GS+ radial glia is decreased at 9dpf following ablation of th2:Gal4+ cells. Images are single optical sections from ventral views of whole-mount brains. Error bars indicate s.e.m.; n=50 optical sections from five brains for each experiment. Scale bars: 10µm. |
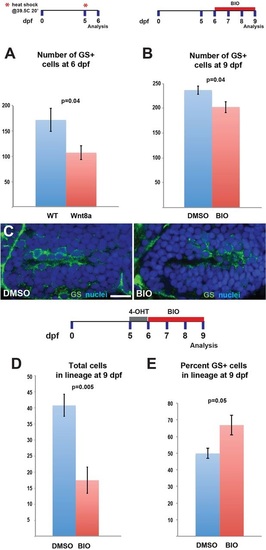
Wnt/β-catenin signaling activation blocks expansion of the radial glial population. (A) Induction of Wnt8a at 5dpf leads to a decrease in the number of GS+ radial glia at 6dpf. (B) Addition of 4µM BIO, a Gsk3β inhibitor, daily from 6-9dpf leads to a decrease in GS+ radial glia. (C) Representative images of labeling for GS in control and BIO-treated larvae. Images are single optical sections from ventral views of whole-mount brains. Scale bar: 10µm. (D) Following recombination from 5-6dpf, incubation in BIO causes a significant decrease in the number of labeled progeny at 9dpf. (E) Incubation in BIO causes a significant increase in the percentage of GS+ cells within the labeled lineage. Error bars indicate s.e.m.; n=40 optical sections from four brains for each experiment. |