
- Title
-
Spatiotemporal analysis of zebrafish hox gene regulation by Cdx4
- Authors
- Hayward, A.G., Joshi, P., Skromne, I.
- Source
- Full text @ Dev. Dyn.
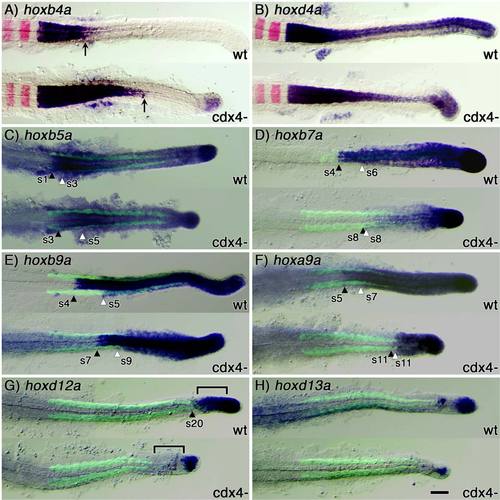
Cdx4 differentially regulates the spatial expression domain of anterior (group 1–4), central (group 5–10) and posterior (group 11–13) hox genes. Expression analysis of hoxb4a (A), hoxd4a (B), hoxb5a (C), hoxb7a (D), hoxb9a (E), hoxa9a (F), hoxd12a (G), and hoxd13a (H) in wild-type (wt) and cdx4-deficient (kgghi2188A mutant) embryos at 20-somite stage of development (purple staining), relative to rhombomeres 3 and 5 (krx20, in red; A,B) or somites (Myosin heavy chain, in green; C–H). Somites (s) were used to determine each gene′s anterior limit of expression as summarized in Figure 3. In A, black arrows indicate posterior limit of expression; and in C–G, black and white arrowheads indicate anterior limit of expression in neural and paraxial mesoderm tissue, respectively. Bracket in F indicate tail tissues where expression of hoxd12a changes in wild-type and Cdx4-deficient embryos. Scale bar = 100 microns. EXPRESSION / LABELING:
PHENOTYPE:
|
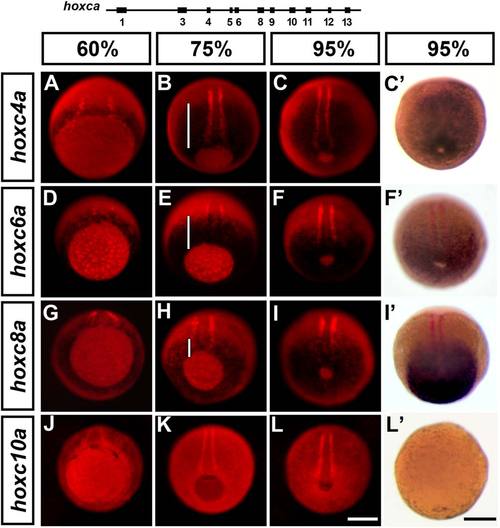
Trunk hoxca initiate transcription during gastrulation in a manner that is collinear with the gene′s position in the cluster. A–L: Expression analysis of hoxc4a (A–C), hoxc6a (D–F), hoxc8a (G–I), and hoxc10a (J–L) in wild-type embryos at 60% epiboly (left column), 75% epiboly (middle column) and 95% epiboly (right-most columns). Because hox expression (revealed using NBT/BCIP) is very weak at these early stages, embryos were counterstained for myod using fast red and photographed using epifluoresence. Fast red trapped in the yolk was used to backlit the specimen and reveal the site of hox transcription as a black shadow (NBT/BCIP precipitate quenches fluorescence). C′,F′,I′,L′: Control embryos at 95%–100% epiboly stained as in C, F, I, and L, and photographed under bright field illumination. At this stage, the increased signal-to-noise ratio of the in situ stain allows direct comparison of expression between embryos photographed under different illumination conditions. Embryos are shown slightly tilted from the vegetal pole, dorsal to the top. Expression of myod in adaxial cells is used as a dorsal reference point to determine hox expression domain at the midline (white bars). Embryo in L2 was not stained for myod. Scale bars = 200 microns. EXPRESSION / LABELING:
|
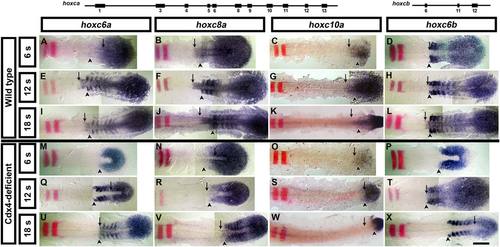
Cdx4 regulates the establishment phase of hoxc genes in the neuroectoderm but not in the paraxial mesoderm. A–X: Expression analysis of trunk hoxc genes in wild-type (A–L) and Cdx4-deficient (M–X) embryos during early (6 somite/12 hpf; A–D, M–P), mid (12 somite/15 hpf; E–H, Q–T) and late (18 somite/18 hpf; I–L, U–X) segmentation stages. A,E,I,M,Q,U: hoxc6a. B,F,J,N,R,V: hoxc8a. C,G,K,O,S,W: hoxc10a. D,H,L,P,T,X: hoxc6b. Expression of hox genes (purple) was aligned using krx20 (rhombomere 3 and 5; red) as a landmark. Anterior limit of hox expression in in the neuroectoderm is indicated with an arrow, and in the paraxial mesoderm with an arrowhead. Embryos were flat mounted anterior to the left. Scale bar = 200 microns. EXPRESSION / LABELING:
PHENOTYPE:
|
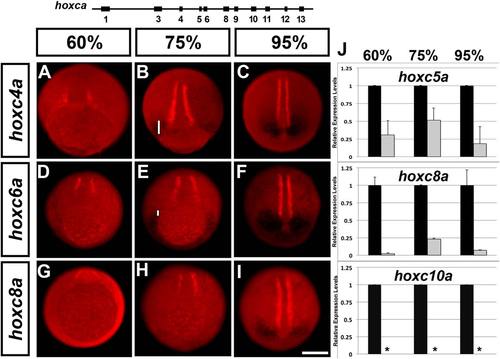
Cdx4 regulates trunk hoxca initiation phase differentially in neural and paraxial mesoderm tissues. A–I: Expression analysis of hoxc4a (A–C), hoxc6a (D–F), and hoxc8a (G–I) genes in Cdx4-deficient (kggtv205 mutant) embryos at 60% epiboly (left column), 75% epiboly (middle column) and 95% epiboly (right-most columns). Embryos were photographed as described in Figure 4, slightly tilted from the vegetal pole, dorsal to the top. PCR was used to confirm cdx4 genotype. Expression of myod (red staining, adaxial cells) was used as a dorsal reference point to determine hox expression domain at the midline (white bars). Scale bar = 200 microns. J: Loss of Cdx4 reduces the level of hox transcription relative to wild-type levels. Levels of hox transcription were normalized to the housekeeping gene ef1α, and are for whole embryo extracts (neural and mesodermal tissues). RT-qPCR genes were selected to supplement in situ analysis and increase cluster coverage. Black bars are wild-type levels (one relative unit), and gray bars are for Cdx4-deficient embryos (morphants). Standard deviations are indicated. Asterisks indicate samples below limit of detection. EXPRESSION / LABELING:
PHENOTYPE:
|