|
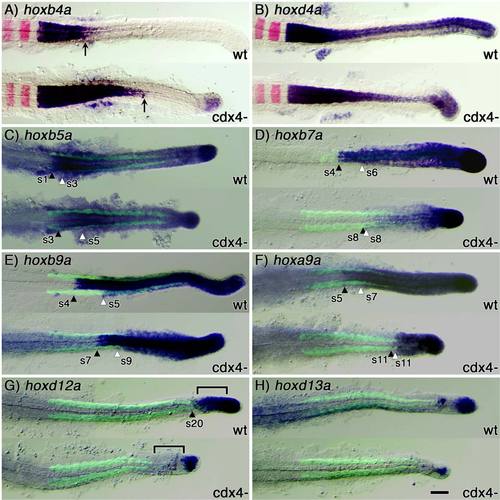
Cdx4 differentially regulates the spatial expression domain of anterior (group 1–4), central (group 5–10) and posterior (group 11–13) hox genes. Expression analysis of hoxb4a (A), hoxd4a (B), hoxb5a (C), hoxb7a (D), hoxb9a (E), hoxa9a (F), hoxd12a (G), and hoxd13a (H) in wild-type (wt) and cdx4-deficient (kgghi2188A mutant) embryos at 20-somite stage of development (purple staining), relative to rhombomeres 3 and 5 (krx20, in red; A,B) or somites (Myosin heavy chain, in green; C–H). Somites (s) were used to determine each gene′s anterior limit of expression as summarized in Figure 3. In A, black arrows indicate posterior limit of expression; and in C–G, black and white arrowheads indicate anterior limit of expression in neural and paraxial mesoderm tissue, respectively. Bracket in F indicate tail tissues where expression of hoxd12a changes in wild-type and Cdx4-deficient embryos. Scale bar = 100 microns.
|