
- Title
-
A functional Bucky ball-GFP transgene visualizes germ plasm in living zebrafish
- Authors
- Riemer, S., Bontems, F., Krishnakumar, P., Gömann, J., Dosch, R.
- Source
- Full text @ Gene Expr. Patterns
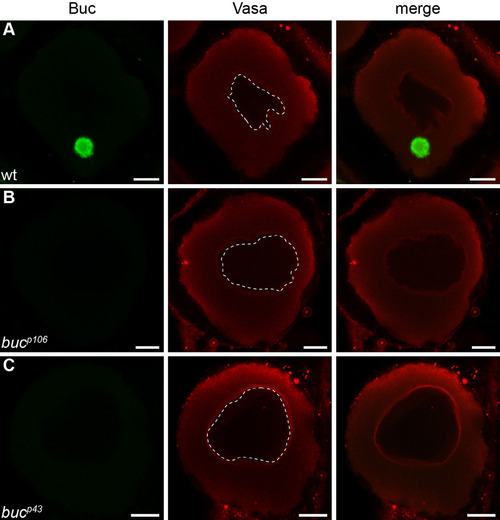
Buc antibody specificity. Confocal images of stage IB oocytes. Buc (green) labels the Balbiani body in wild type oocytes (A) but not in mutants bucp106 (B) and bucp43 (C). By contrast, perinuclear Vasa (red) is not changed. Dashed line outlines the nucleus. Lateral views, animal to the top. Scale bar: 10 µm. |
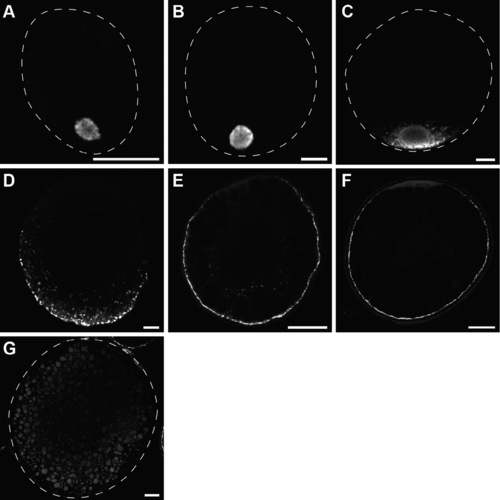
Buc localization during oogenesis. Confocal images of wild-type oocytes, labeled with Buc antibody (white) at stage IA (A), early IB (B), late IB (C, D), early II (E), late II (F) and III (G). Buc moves with the germ plasm to the vegetal pole. Stippled line indicates outline of oocytes (A–C, G). Lateral views, animal to the top. Scale bar: 10 µm (A–D) and 50 µm (E–G). EXPRESSION / LABELING:
|
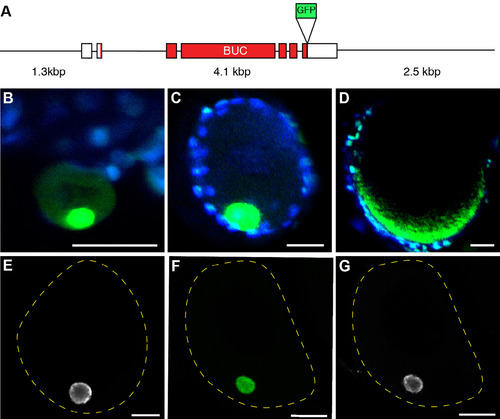
Buc-GFP transgenic zebrafish. (A) Scheme showing the genomic Buc locus used to generate the Buc-GFP line. Thin lines represent non-coding regions. Boxes represent exons (white: untranslated RNA; red: coding RNA). The green box marks the insertion point of the GFP-protein in front of the STOP-codon. (B–D) Live images of Buc-GFP (green) in oocytes from transgenic mothers at early stage IB (B), late IB (C), and II (D). The nuclei of follicle cells were counterstained with the live-cell fluorescent dye Hoechst 33342 (blue). (E–G) Confocal images comparing endogenous Buc localization with Buc-GFP. (E) Wild-type stage IB oocyte labeled with Buc antibody (white) compared to transgenic Buc-GFP oocyte labeled with GFP antibody (F; green) and Buc (G; white). Dashed yellow line indicates oocyte outline (E–G). Lateral view, animal to the top. Scale bar: 10 µm (E–G) 25 µm (B–D). EXPRESSION / LABELING:
|
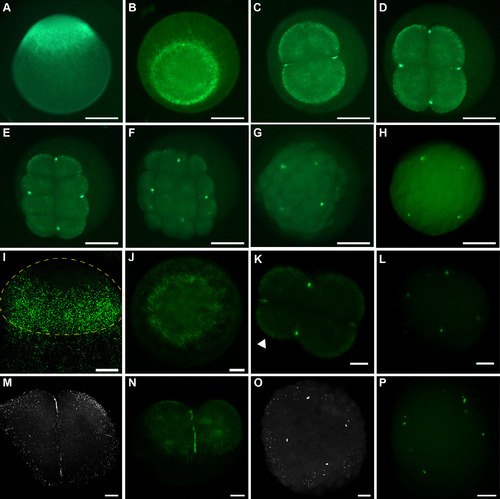
Buc-GFP localization during embryogenesis. (A–H) Images of living embryos from Buc-GFP mothers at 1- (A, B), 2- (C), 4- (D), 8- (E), 16- (F), 128-cell (G), and high stage (H). (I–L) Confocal images of living embryos from transgenic mothers at the 1- (I, J), 4-(K), and 256-cell-stage (L). (I) Dashed yellow line outlines the blastomere in the zygote. Note that the animal region was free of fluorescent signal. (J) Fluorescent granules formed a ring at the preaggregation stage. (K, L) The four blastomeres accumulated fluorescent granules at their cortex (arrowhead), which disappeared by the 256-cell stage. (M–P) Confocal images comparing endogenous Buc (white) in wild-type (M, O) with GFP (green) in Buc-GFP embryos (N, P) at the 2-cell (M, N) or high-stage stage (O, P). (A, I) Lateral views, (B–H, J–P) animal views. Scale bar: 50 µm (N, P), 100 µm (I–M, O), 200 µm (A–H). |
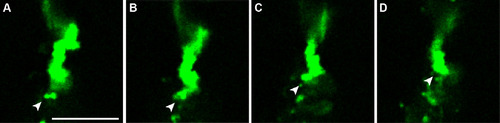
Zebrafish germ plasm dynamics suggest liquid droplet-like behavior. (A–D) Still pictures from confocal Movie S5 show the condensation of two granules (white arrowhead) with a germ plasm aggregate. Scale bar: 20 µm. |
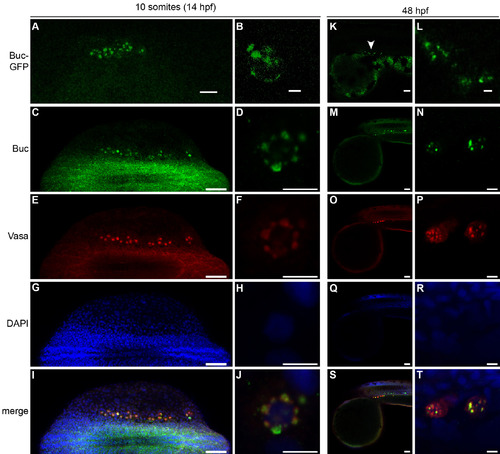
Buc is expressed in larval stages. (A–J) Confocal images of 10-somite stage embryos (14 hpf) in dorsal view, anterior to the left. Only the right half was magnified for imaging (A, C, E, G, I). Magnification of single PGCs at 10-somite stage (B, D, F, H, J). (A, B) Living embryos showing Buc-GFP in germ cells (A), forming perinuclear granules (B). (C–J) Wild-type embryos labeled with Buc-antibody (C, D; green) in germ cells (E, F; Vasa in red) and nuclei (G, H; labeled blue with DAPI). The merge (I, J) shows the colocalization of Buc in Vasa-positive, perinuclear granules. (K–T) Confocal images of 48 hpf embryos in lateral view, anterior to the left. Buc-GFP is expressed in living germ cells (K, L; white arrowhead). (M–T) Buc antibody labeling confirms the co-expression of endogenous Buc (M, N; green) in wild-type embryos with the PGC marker Vasa (O–T; red). Scale bar: 5 µm (B, D, F, H, J, L, N, P, R, T); 50 µm (A, C, E, G, I, K, M, O, Q, S). EXPRESSION / LABELING:
|
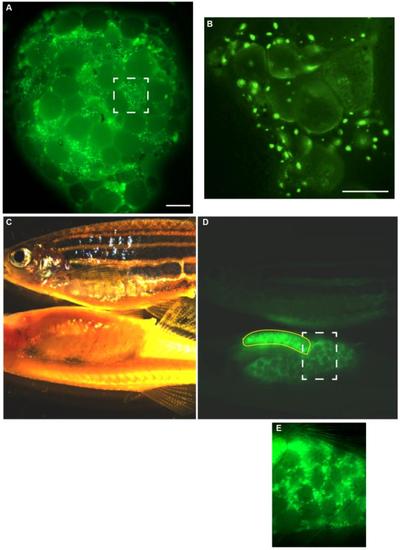
Expression of Buc-GFP in ovaries. (A, B) Living ovary from an adult F1- female transgenic for Buc-GFP. Dashed square highlights the magnified area in B. Scale bar: 700 µm. (B) Magnification showing that the fluorescence of Buc-GFP is obscured during oogenesis probably by the uptake of yolk protein. Scale bar: 200 µm. (C-E) Comparison of a wild-type (top) and casper female (bottom) carrying a Buc-GFP transgene in incident (C) and fluorescent light (D). Yellow line encompasses the stomach with autofluorescent food residues in the digestive tract. Dashed square highlights the magnified area in (E). |
Reprinted from Gene expression patterns : GEP, 18(1-2), Riemer, S., Bontems, F., Krishnakumar, P., Gömann, J., Dosch, R., A functional Bucky ball-GFP transgene visualizes germ plasm in living zebrafish, 44-52, Copyright (2015) with permission from Elsevier. Full text @ Gene Expr. Patterns