
- Title
-
Tfap2a Promotes Specification and Maturation of Neurons in the Inner Ear through Modulation of Bmp, Fgf and Notch Signaling
- Authors
- Kantarci, H., Edlund, R.K., Groves, A.K., Riley, B.B.
- Source
- Full text @ PLoS Genet.
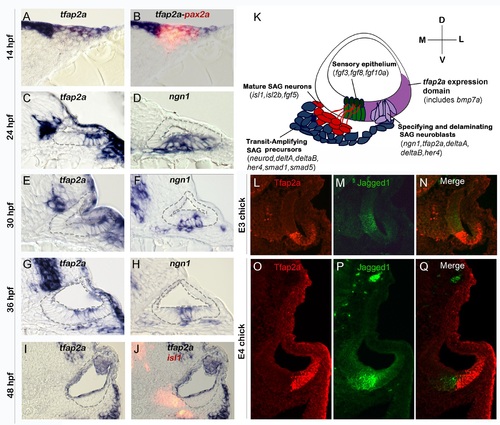
Conserved expression of tfap2a during otic neurogenesis. All images show cross-sections of the otic placode or vesicle in wild type zebrafish embryos (A-J) or chick embryos (L-Q) with a dorsal up and medial to the left. (A, B) At 14 hpf (10 somites) pax2a (red) marks the precursor cells in the emerging otic placode that are co-labeled with tfap2a (blue). (C-H) Cross-sections through the widest part of the neurogenic domain of the otic vesicle, just posterior to the utricular macula. The outer and inner edges of the otic vesicle are outlined. Patterns of ngn1 or tfap2a are shown at the indicated times. tfap2a is expressed in the ventrolateral part of the otic vesicle, which partially overlaps the domain of ngn1 expression. (I-J) Cross-sections passing through the utricular macula of specimens co-stained for Isl1 (red) and tfap2a (blue) at 48 hpf. Expression of tfap2a is not detected in the floor of the otic vesicle or in the mature SAG neurons at this time. (K) Schematic summary of SAG development in zebrafish, including regional markers. Neuroblasts are specified and delaminate from the otic vesicle (light purple) adjacent to nascent sensory epithelia (green). Recently delaminated neuroblasts migrate towards hindbrain and continue to proliferate, forming the transit-amplifying pool (blue). Neuroblasts then stop dividing and differentiate into mature neurons (red). Relevant genes expressed in each domain are indicated. Expression of tfap2a (dark purple) overlaps the neurogenic domain, as well as the domain of bmp7a expression. Note that all of the tissues indicated express Fgf-target genes (etv5b and spry4) and transducers of Bmp (smad1 and smad5), but transit amplifying SAG precursors show specific upregulation of smad1 and smad5 [37]. (L-Q) Cross-sections through the otic vesicle of chick embryos at days 3 and 4 (E3 and E4). The sensory region is labeled with Jagged-1 (green). Tfap2a (red) is expressed in the ventrolateral otic domain in chick embryos similar to the pattern observed in zebrafish. EXPRESSION / LABELING:
|
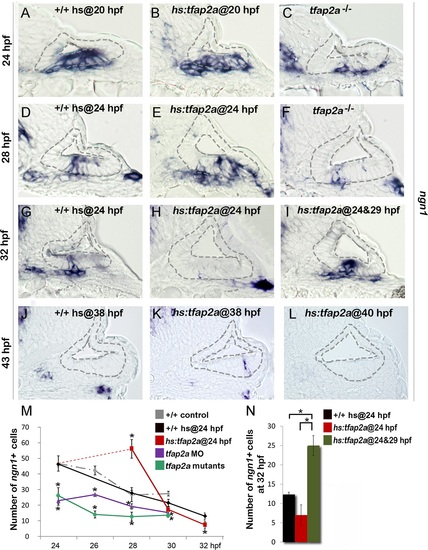
Tfap2a enhances otic neurogenesis. (A-L) Cross-sections (medial left, dorsal up) through the otic region just posterior to the utricular macula showing ngn1 expression in +/+ control embryos, hs:tfap2a embryos and tfap2a-/- mutants at the indicated times. Wild-type and hs:tfap2a embryos were heat shocked as indicated in each panel. Overexpression of tfap2a increases the number of neuroblasts in the otic vesicle whereas loss of tfap2a slows down and decreases otic neurogenesis. The outer and inner edges of the otic vesicle are outlined in each image. (M, N) Mean and standard deviation of the total number of ngn1 positive cells in the otic epithelium from 24 to 32 hpf for the genotypes indicated in the color key (counted from serial sections, n = 3–7 ears per time point). Asterisks (*) indicate statistically significant differences between groups indicated by brackets (N) or compared to control embryos (M). |
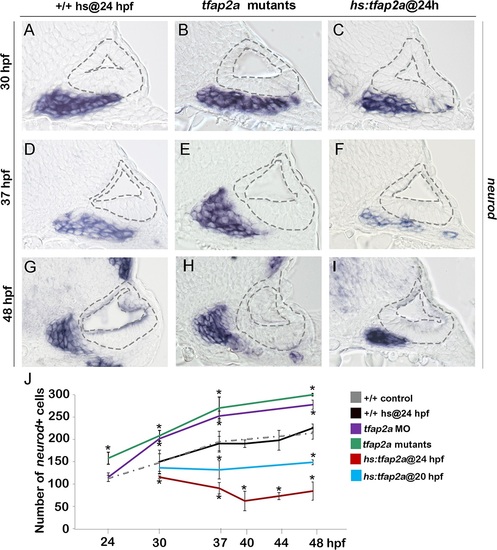
Tfap2a regulates the number of transit-amplifying SAG precursors. (A-I) Cross-sections (medial left, dorsal up) at the level of the utricular macula showing neurod expression in +/+ control, tfap2a mutants and hs:tfap2a embryos. Wild-type and hs:tfap2a embryos were heat shocked at 24 hpf. Disruption of tfap2a leads to accumulation of excess TA cells whereas tfap2a overexpression decreases the number of the TA cells. The outer and inner edges of the otic vesicle are outlined in each image. (J) Mean and standard deviation of the total number of neurod positive SAG precursors for the genotypes and conditions indicated in the color key (counted from serial sections, n = 3–6 ears per time point). Asterisks (*) indicate significant differences from control specimens. |
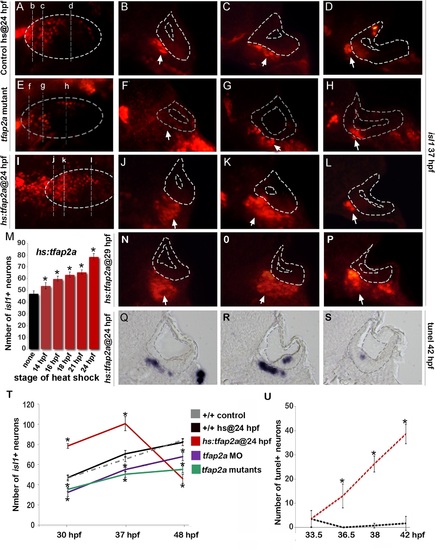
Tfap2a regulates maturation of SAG neurons. (A-L) Images of anti-Isl1 antibody staining in control embryos (A-D), tfap2a-/- mutants (E-H) and hs:tfap2a embryos (I-L) at 37 hpf. Control and hs:tfap2a embryos were heat shocked at 24 hpf. Whole-mount specimens (A, E, I) show dorsolateral (anterior to the left) and indicate planes of cross-section in (B-D), (F-H) and (J-L). Cross-sections are oriented with dorsal up and medial to the left. The otic vesicle is outlined in each image. White arrows indicate the SAG population to help distinguish it from other Isl1+ populations present in some sections. (M) Total number of Isl1+ neurons in hs:tfap2a embryos at 30 hpf following heat shock at the indicated times (n = 10–15 each). (N-P) Cross-sections of a hs:tfap2a specimen at 37 hpf following heat shock at 29 hpf. Planes of section are similar to those shown in (I). (Q-S) Cross-sections of a hs:tfap2a embryo stained for TUNEL positive SAG neurons at 42 hpf. (T) Mean and standard deviation of the total number of Isl1+ SAG neurons at the indicated times in +/+ embryos, hs:tfap2a embryos, tfap2a-/- mutants and tfap2a morphants (n = 7–34 embryos per time point). (U) Mean and standard deviation of the total number of TUNEL positive SAG neurons at the indicated times in control embryos and hs:tfap2a embryos (counted from serial sections, n = 3–6 ears per time point). Asterisks (*) indicate statistically significant differences compared to control embryos. |
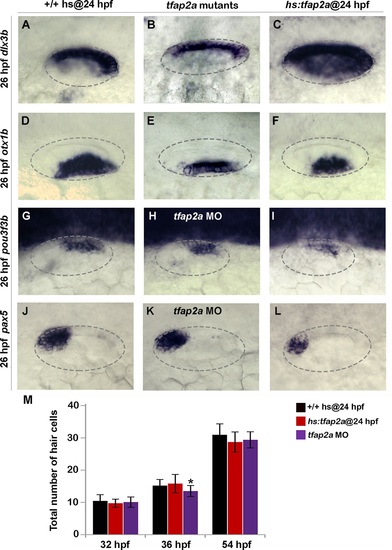
Effects of tfap2a knockdown and overexpression on otic vesicle patterning. (A-L) Whole-mount images (dorsal up, anterior left) showing dorsolateral views of the otic vesicle (outlined) in control embryos, tfap2a-/- mutants and tfap2a morphants, and hs:tfap2a embryos for the indicated genes at 26 hpf. (M) Mean and standard deviation of the total number of hair cells in utricular and saccular maculae of control and hs:tfap2a embryos and tfap2a morphants at the indicated times (n = 24 embryos each). Data were obtained by counting GFP-positive hair cells in the sensory epithelia of brn3c:Gfp transgenic embryos. Accumulation of hair cells was normal except in tfap2a morphants at 36 hpf (*), which showed a small but significant decrease relative to the control. |
Tfap2a regulates the level of Fgf and Notch Signaling in the otic vesicle. (A-V) Whole-mount images (dorsal up, anterior left) showing dorsolateral views of the otic vesicle (outlined). (A-R) Expression of the indicated genes in wild-type embryos, hs:tfap2a embryos and tfap2a-/- mutants (A-I) or tfap2a morphants (J-R) at 26 hpf (A-L, P-R) and 28 (M-O) hpf. (S, T) Cross-sections (dorsal up, medial left) passing through the utricular macula show spry4 expression at 28 hpf in a control embryo and tfap2a-/- mutant. (U-X) Whole-mounts showing expression of etv5b at 26 hpf. Activation of hs:tfap2a diminishes etv5b expression (U, V), activation of hs:fgf8 leads to global upregulation of etv5b (W), and co-activation of hs:fgf8 and hs:tfap2a restores etv5b to near normal (X). (Y) Cross-sections (dorsal up, medial left) passing just posterior to the utricular macula showing ngn1 at 24 hpf following a 35°C heat shock at 23 hpf. Reduction in the ngn1 domain caused by knockdown of tfap2a is rescued by weak activation of hs:dnfgfr1. (Z) Mean and standard deviation of the total number of ngn1 positive cells in the otic epithelium at 24 hpf for the genotypes and knockdowns indicated in the color key (counted from serial sections, n = 3–6 ears per time point). Asterisks (*) indicate statistically significant differences between the groups indicated in brackets. |
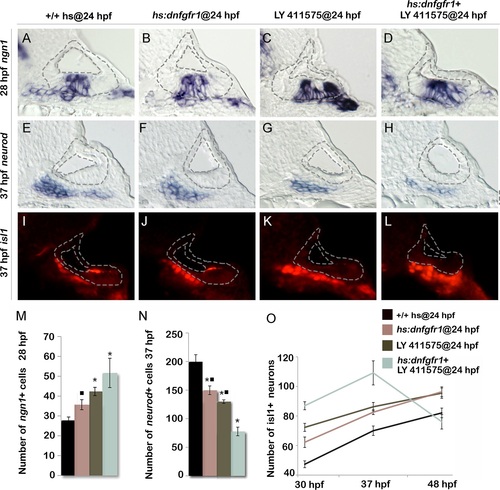
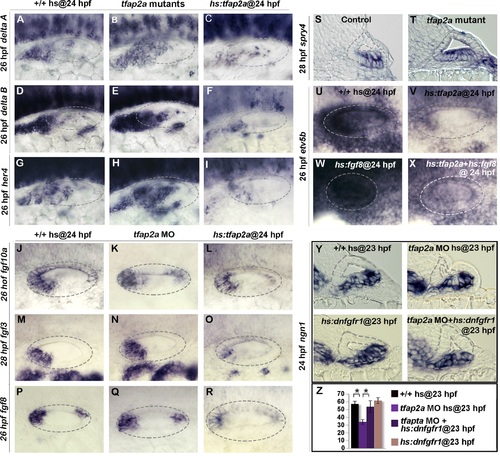
Reducing Fgf and Notch levels mimics the effects of tfap2a overexpression. (A-L) Cross-sections (medial left, dorsal up) passing just posterior to the utricular macula and showing expression of ngn1 at 28 hpf (A-D), or sections passing through the utricular macula and showing neurod at 37 hpf (E-H) or Isl1 at 37 hpf (I-L) in wild-type control (A, E, I), hs:dnfgfr1 embryos (B, F, J), LY411575 inhibitor treated wild-type embryos (C, G, K) and LY411575 inhibitor treated hs:dnfgfr1 embryos (D, H, L). All specimens were treated with 0.3% DMSO and heat-shocked at 24 hpf. The otic vesicle is outlined in each image. (M, N) Mean and standard deviation of the total number of ngn1 positive cells in the otic epithelium at 28 hpf (M) and total neurod positive SAG precursors at 37 hpf (N) for the genotypes and treatments indicated in the color key (counted from serial sections, n = 3–6 ears per time point). Asterisks (*) indicate significant differences from control embryos and filled squares indicate significant differences relative to hs:dnfgfr1 embryos treated with LY411575. (O) Mean and standard deviation of the total number of Isl1 positive SAG neurons at different times for the genotypes and treatments indicated in the color key (n = 6–15 embryos each). In (O) differences between control and experimental specimens were significant at each time point. In addition, LY411575 treated hs:dnfgfr1 embryos were significantly different from hs:dnfgfr1 alone or LY411575 treatment alone. EXPRESSION / LABELING:
PHENOTYPE:
|
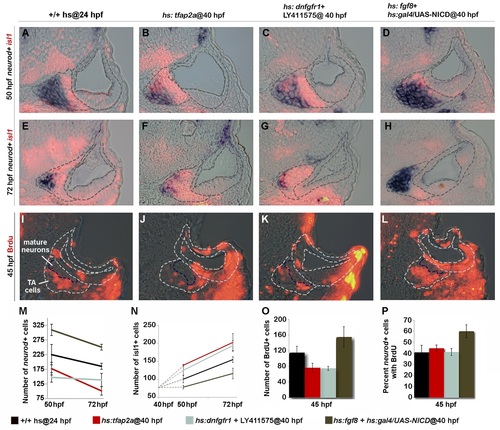
Tfap2a regulates development of TA cells independent of earlier stages. (A-L) Cross-sections (medial left, dorsal up) at the level of utricular macula. The otic vesicle and regions occupied by mature SAG neurons and TA cells are outlined in each image. Co-staining for Isl1 (red) and neurod (blue) at 50 hpf (A-D) and 72 hpf (E-H) under conditions indicated across the top of the figure. All specimens were treated with 0.3% DMSO and heat-shocked (39°C) at 40 hpf. (I-L) BrdU staining in embryos exposed to BrdU for 5 hours, from 40 to 45 hpf. The region containing mature SAG neurons is indicated. (M-O) Mean and standard deviation for the total number of neurod+ TA cells (M), total Isl1+ mature neurons (N) and total BrdU+ TA cells (O) for the indicated genotypes and treatments (counted from serial sections, n = 3–6 ears per time point). Differences between control and experimental specimens were significant at all time points, except that hs:fgf8+hs:gal4/UAS-NICD embryos were not significantly different from control embryos at 72 hpf in (N). (P) Percentage of neurod+ TA cells that are also BrdU positive (counted from serial sections, n = 3–6 ears per time point). Only hs:fgf8+hs:gal4/UAS-NICD embryos were significantly different from the control in (P). EXPRESSION / LABELING:
PHENOTYPE:
|
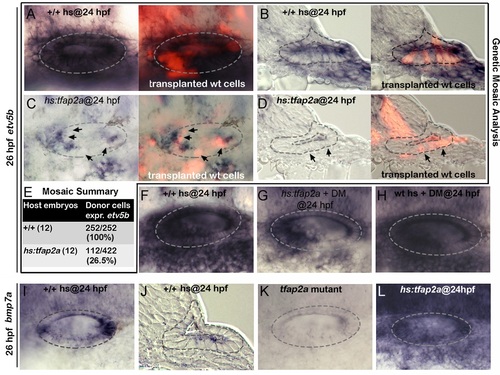
Tfap2a regulates SAG development non-autonomously. (A-D) Whole-mounts (dorsal up, anterior left) and cross-sections (just posterior to utricular macula, medial to the left) showing both bright-field and corresponding fluorescent images of +/+ host embryos (A, B) and hs:tfap2a host embryos stained for etv5b expression (blue) and showing transplanted wild-type donor cells (red). Positions of wild-type cells that fail to express etv5b are highlighted with arrows in (C, D). (E) Summary of mosaic analysis showing the number of +/+ or hs:tfap2a host embryos examined and the number of +/+ donor cells expressing etv5b over the total number of donor cells that populated the ventral half of the otic vesicle. (F-H) Expression of etv5b at 26 hpf in a control (F), a DM-treated hs:tfap2a embryo (G) and DM-treated wild-type embryo (H). All specimens were treated with 1% DMSO and heat-shocked at 24 hpf. (I-L) Expression of bmp7a at 26 hpf in a control (I, J), tfap2a-/- mutant (K) and hs:tfap2a embryo (L). Wild-type and hs:tfap2a embryos were heat shocked at 24 hpf. |
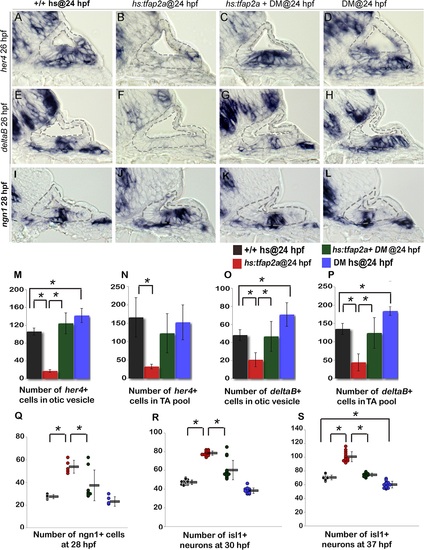
Bmp signaling mediates the effects of Tfap2a on SAG development. (A-L) Cross sections (medial left, dorsal up) through the otic vesicle just posterior to the utricular macula showing expression of her4 (A-D) and deltaB (E-H) at 26 hpf and ngn1 (I-L) at 28 hpf in control embryos (A, E, I), hs:tfap2a embryos (B, F, J), DM-treated hs:tfap2a embryos (C, G, K) and DM-treated wild-type embryos (D, H, L). All specimens were treated with 1% DMSO and heat-shocked at 24 hpf. (M-P) Mean and standard deviation of the total number of deltaB or her4 expressing cells inside the otic vesicle or in the TA pool at 26 hpf under conditions indicated in the color key (counted from serial sections, n = 3–6 ears per time point). (Q-S) Mean and standard deviation of the total number of ngn1+ cells at 28 hpf (Q) and Isl1+ SAG neurons at 30 hpf (R) and 37 hpf (S) under the conditions indicated in the color key. Asterisks (*) indicate statistical differences between the groups indicated in brackets. |
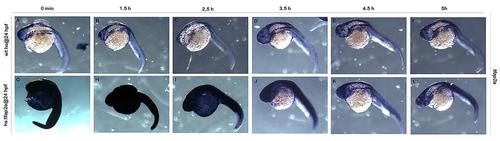
Heat-shock activation of hs:tfap2a transgene leads to transient misexpression of tfap2a. (A-L) Whole-mount images (dorsal up, anterior left) showing tfap2a expression in wild-type and hs:tfap2a embryos. Embryos were fixed and stained at indicated intervals after the end of a 30-minute heat-shock initiated at 24 hpf. |
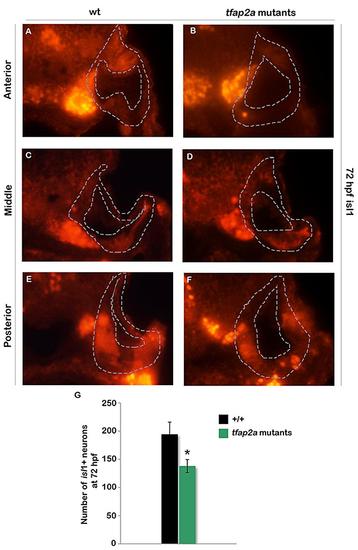
Maturation of SAG neurons remains deficient in tfap2a mutants at 3 dpf. (A-F) Cross-sections (dorsal up, medial left) pass through the anterior (A, B), middle (C, D), and posterior (E, F) parts of the otic vesicle and show isl1 staining in a wild-type embryo (A, C, E) and a tfap2a mutant (B, D, F) embryo at 72 hpf. (G) Mean and standard deviation of the total number Isl1+ SAG neurons in wild-type (n = 3) and tfap2a mutant (n = 4) embryos at 72 hpf (counted on serial sections). Asterisk (*) indicate statistically significant difference compared to wild-type embryos. |
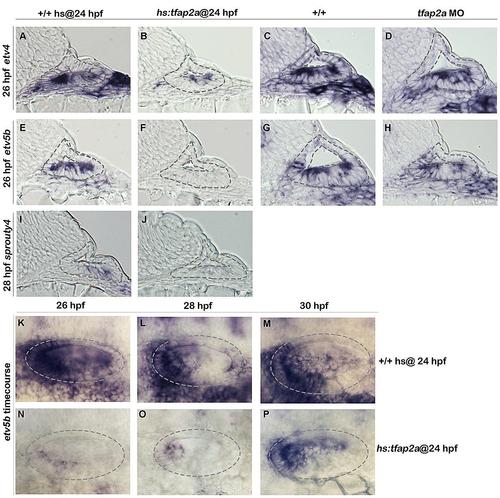
tfap2a inhibits Fgf signaling in the otic vesicle. (A-J): Cross-sections (dorsal up, medial left) passing through the otic vesicle just posterior to the utricle showing expression of etv4 (A-D), etv5b (E-H) and sprouty4 (I, J) in heat-shocked wild-type (A, E, I), hs:tfap2a (B, F, J), non-heat shocked wild-type (C,G) and tfap2a morphant (D,H) embryos at indicated time points. (K-P): Whole-mount images (dorsal up, anterior left) showing dorsolateral views of the otic vesicle (outlined) stained for etv5b expression in heat-shocked wild-type and hs:tfap2a embryos at indicated times. |
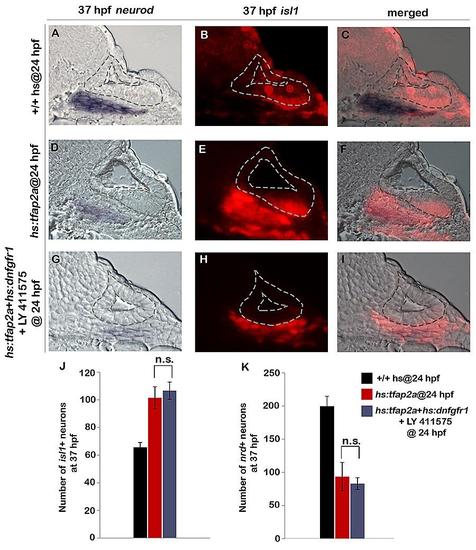
Inhibition of Notch and Fgf signaling in hs:tfap2a embryos does not enhance the effects of hs:tfap2a activation. (A-I): Cross-sections at the level of utricular macula (medial to the left, dorsal up) show bright field (A, D, G), fluorescent (B, E, H) and merged (C, F, I) images for neurod (blue) and isl1 (red) in heat-shocked wild-type, hs:tfap2a and LY 411575 treated hs:tfap2a+ hs:dnfgfr1 embryos at 37 hpf. All specimens were treated with 0.3% DMSO and heat-shocked (39°C, 30 minutes) at 24 hpf. (J) Mean and standard deviation of the total number of is1+ neurons at 37 hpf under the conditions indicated in the color key (n = 10–15 specimens each). (K) Mean and standard deviation of the total number of nrd+ neuroblasts at 37 hpf under the conditions indicated in the color key (n = 3–6 ears each, counted from serial sections). Both experimental conditions were significantly different compared to controls. n.s., no statistical difference between the groups indicated in brackets. |
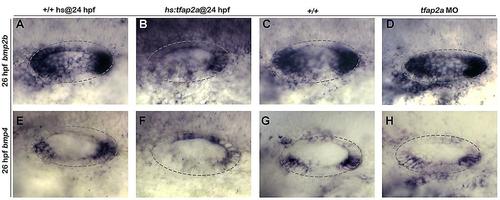
The effects of tfap2a overexpression and knock-down on bmp2b and bmp4 expression. (A-H): Whole-mount images (dorsal up, anterior left) showing dorsolateral view of the otic vesicle (outlined) for bmp2b (A-D) and bmp4 (E-H) expression for the indicated genotypes and conditions. Activation of hs:tfap2a appears to reduce expression of both genes in portions of the otic vesicle, but bmb2b is upregulated in the hindbrain (B) and bmp4 is upregulated in the dorsal part of the otic vesicle (F). Knocking down tfap2a had little or no effect on either gene (D, H). |