
|
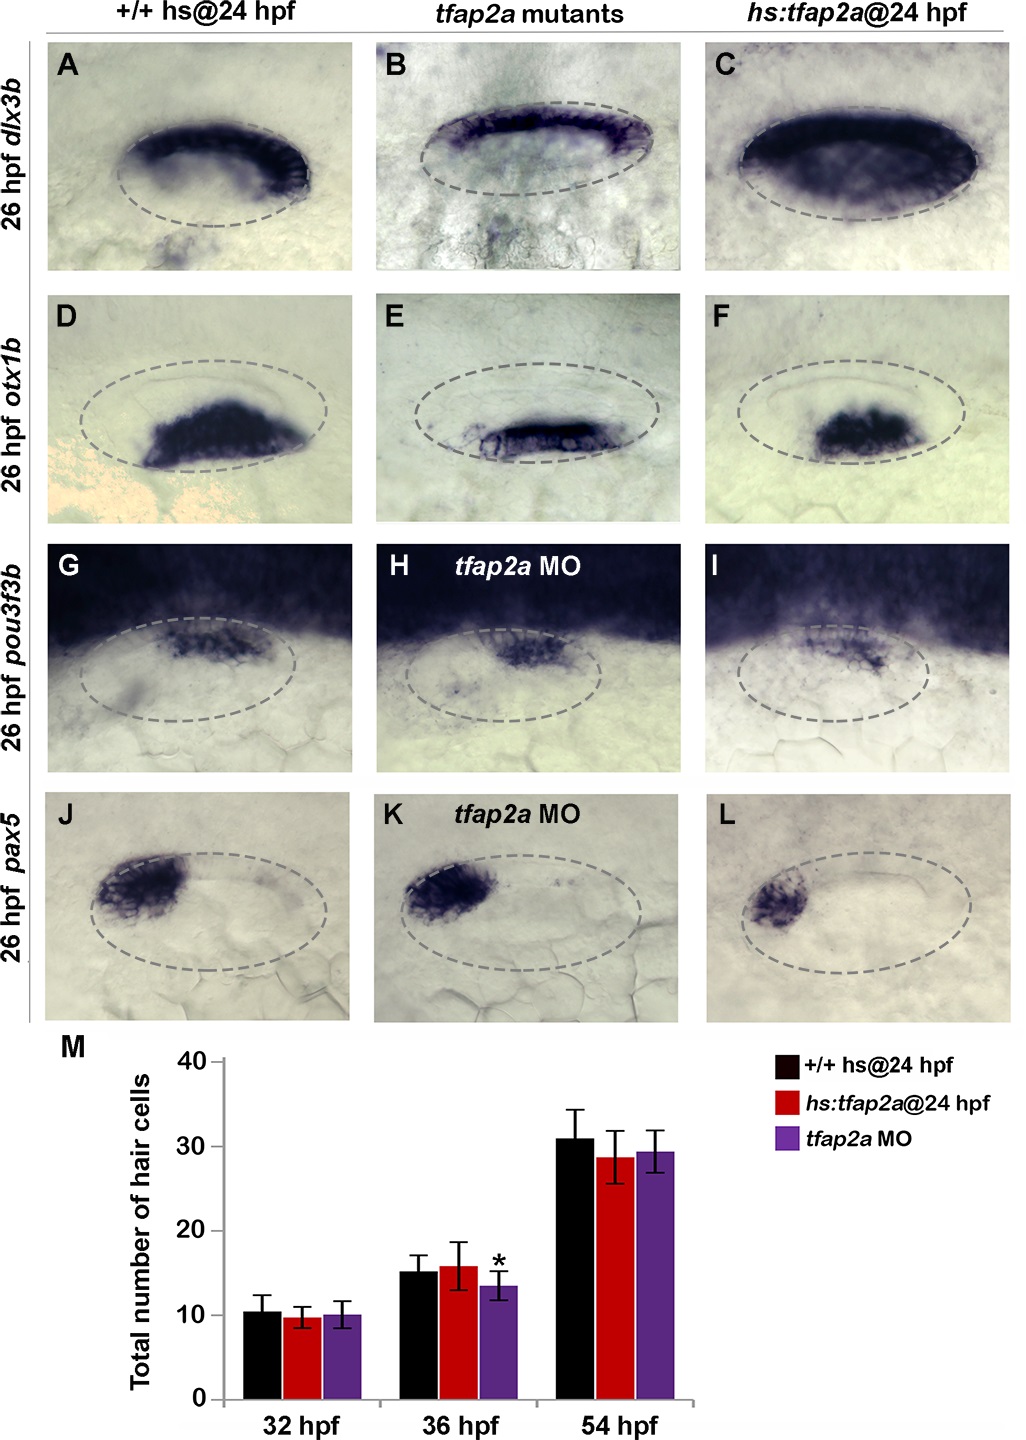
Fig. 5 Effects of tfap2a knockdown and overexpression on otic vesicle patterning.
(A-L) Whole-mount images (dorsal up, anterior left) showing dorsolateral views of the otic vesicle (outlined) in control embryos, tfap2a-/- mutants and tfap2a morphants, and hs:tfap2a embryos for the indicated genes at 26 hpf. (M) Mean and standard deviation of the total number of hair cells in utricular and saccular maculae of control and hs:tfap2a embryos and tfap2a morphants at the indicated times (n = 24 embryos each). Data were obtained by counting GFP-positive hair cells in the sensory epithelia of brn3c:Gfp transgenic embryos. Accumulation of hair cells was normal except in tfap2a morphants at 36 hpf (*), which showed a small but significant decrease relative to the control.