
- Title
-
Presynaptic architecture of the larval zebrafish neuromuscular junction
- Authors
- Helmprobst, F., Frank, M., Stigloher, C.
- Source
- Full text @ J. Comp. Neurol.

Differences in ultrastructural preservation in chemically fixed and cryoimmobilized and freeze substituted samples. The overview shows electron micrographs of a chemically fixed (A) and an HPF/FS-treated (E) synapse (S) of a ~250-nm-thick section from a 4-dpf zebrafish larva. Synapses are surrounded by muscle cells (M) with an electron-dense synaptic cleft (white arrows) in between (B,C,F,G). C and G show a tomogram slice per synapse. Mitochondria (asterisks) and synaptic vesicles (black arrows) are annotated. A higher magnification image of the boxed region in C and G is shown in D and H, respectively. Scale bars = 1 µm A,E; 500 nm in B,F; 200 nm in C,G; 100 nm in D,H. |
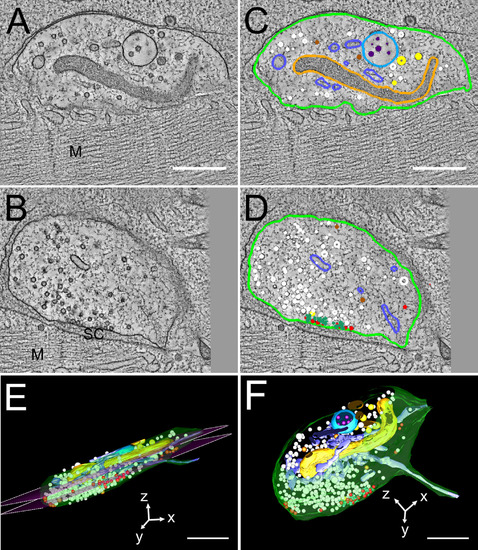
Three-dimensional model of an NMJ of a 4-dpf zebrafish larva. Three serial tomograms (~600 nm overall thickness) were joined to show the extent of an NMJ. A and B show single slices of the tomograms. The tomograms were annotated in 3dmod (C,D) to highlight cellular structures in the synapse. The synapse is next to a muscle cell (M) with a synaptic cleft (SC) between and surrounded by a membrane (light green). In the synapse, synaptic vesicles (white), mitochondria (orange), endoplasmic reticulum (light blue), two types of dense-core vesicles (brown and yellow), and large multivesicular bodies (turquois) with internal vesicles (purple) were found. Docked synaptic vesicles at the presynaptic membrane are annotated in red. At the active zone we observed electron-dense structures (green), which are surrounded by many docked vesicles. E and F show the whole 3D model of the synapse. The magenta planes in E show the borders, where the three tomograms were joined. Scale bars = 500 nm. |

Differences in size of the synaptic vesicles in NMJs from 4-dpf and 8-dpf zebrafish larvae. Tomograms of NMJs from 4-dpf (A) and 8-dpf (E) zebrafish larvae were taken and the structures were annotated (B,F). In the synapse, synaptic vesicles (white), docked vesicles (red) at the cell membrane (light green), mitochondria (orange), endoplasmic reticulum (light blue), endosomal structures (dark brown), microtubules (dark blue), two types of dense-core vesicles (brown and yellow), and large multivesicular bodies (turquois) were found. 3D models are shown either with all structures (C,G) or with only the vesicle pools of the synapses visible (D,H). The measurements of the sizes of the synaptic vesicles pools at 4 and 8 dpf (I) shows that in 4-dpf zebrafish larvae the radius of synaptic vesicles (23.9 ± 2.5 nm, n = 1,095 vesicles, mean ± SD) is highly significantly larger than that in 8-dpf zebrafish larvae (22.2 ± 2.7 nm, n = 1,020 vesicles, mean ± SD). Scale bars = 200 nm. |
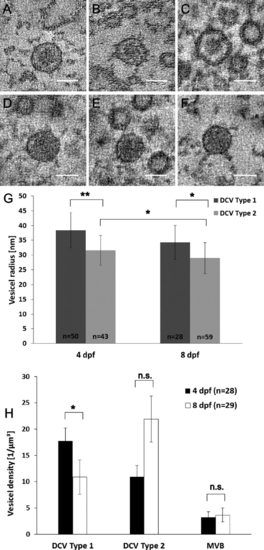
Two types of dense-core vesicles differ in size and appearance. Three different tomogram slices through the middle of type 1 dense-core vesicles (DCV) are shown (A-C). Type 1 DCVs have an electron-dense core surrounded by an electron-clear structure between the membrane and the core. In D-F three different tomogram slices through the middle of type 2 DCVs with a homogeneous dense structure are shown. Type 1 DCV have a radius (G) of 38.4 ± 6.0 nm (n = 50 vesicles from 26 single and double tilt tomograms, mean ± SD) in 4-dpf zebrafish larvae and a mean radius of 34.3 ± 5.8 nm (n = 28 vesicles from 16 single and double tilt tomograms, mean ± SD) in 8-dpf zebrafish larvae, differing significantly [**P < 0.001 (4 dpf) and *P < 0.05 (8 dpf), KS test] from the radius of type 2 DCV of 31.6 ± 5.1 nm (n = 43 vesicles from 18 single and double tilt tomograms, mean ± SD) in 4-dpf zebrafish larvae and 29.0 ± 5.3 nm (n = 59 vesicles from 24 single and double tilt tomograms, mean ± SD) in 8-dpf samples. The density (H) of type 1 dense-core vesicles is significantly higher in NMJs of 4-dpf zebrafish, 17.7 ± 2.5 vesicles/µm3 (n = 28 single and double tilt tomograms, mean ± SEM), than in NMJs of 8-dpf zebrafish, 10.9 ± 3.3 vesicles/µm3 (n = 29 single and double tilt tomograms, mean ± SEM). The density (H) of type 2 DCVs is 11.0 ± 2.1 vesicles/µm3 (n = 28 single and double tilt tomograms, mean ± SEM) in NMJs of 4-dpf zebrafish larvae and 21.9 ± 4.4 vesicles/µm3 (n = 29 single and double tilt tomograms, mean ± SEM) in NMJs of 8-dpf zebrafish larvae. The density of multivesicular bodies does not differ significantly in 4-dpf (3.2 ± 1.1 vesicles/µm3, n = 28 single and double tilt tomograms, mean ± SEM) and 8-dpf (3.7 ± 1.3 vesicles/µm3, n = 29 single and double tilt tomograms, mean ± SEM) larvae. Scale bars = 50 nm. |

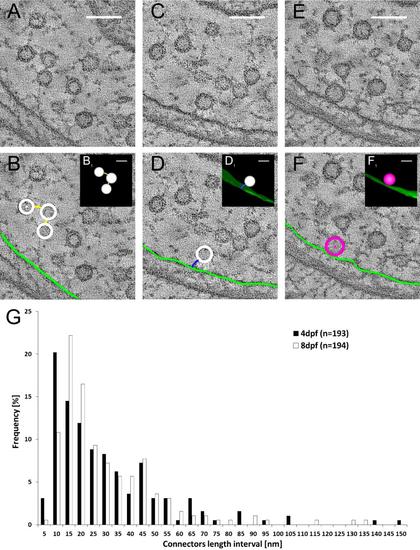
The filamentous network between synaptic vesicles and between the membranes and vesicles. Single tomogram slices are shown, in which synaptic vesicles are interconnected by filaments (connectors; A,B), and connected to the membrane via small filaments (tethers; C,D). Example of a docked synaptic vesicle located directly at the cell membrane without a visible filament between is shown in E and F. In B, D, and F the synaptic vesicles are annotated in white, the connectors in yellow, the tethers in blue, the cell membrane in light green, and the docked vesicles in red. B1, D1, and F1 show 3D models of the annotated structures. The connectors between synaptic vesicles were measured in 4-dpf and 8-dpf zebrafish larvae (G). A magenta/green version of this figure is available as Supporting Information Figure 1. Scale bars = 100 nm in A-F; 50 nm in B1-F1. |
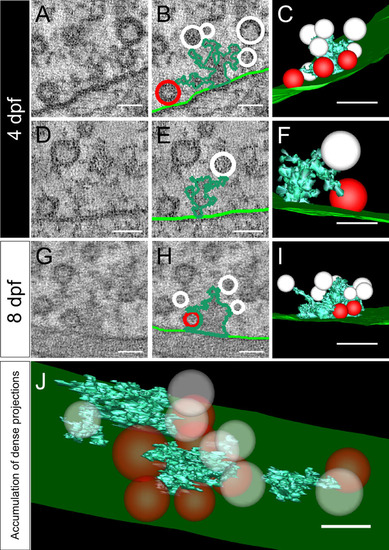
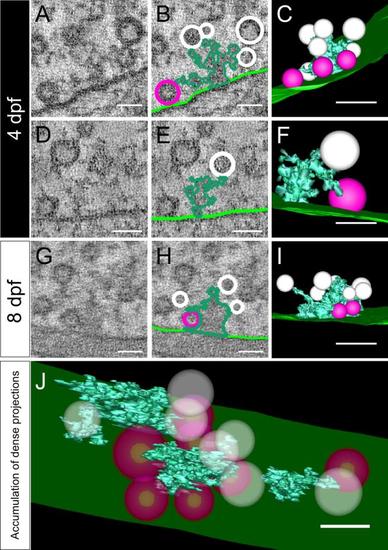
Dense projections link synaptic vesicles to the presynaptic membrane. Shown are tomograms of dense projections in 4-dpf (A,D) and 8-dpf (G) zebrafish. They were segmented (B,E,H) and rendered into 3D models (C,F,I). Light green, presynaptic membrane; dark green, dense projection; white, synaptic vesicles; red, docked vesicles. All segmentations and 3D models show only the vesicles directly connected to dense projections. A-C and D-F: Typical dense projections in 4-dpf larvae. G-I: Dense projections found in 8-dpf larvae. J: Same tomogram as in D but showing all dense projections found. For a better overview, all vesicles are shown as transparent (J). A magenta/green version of this figure is available as Supporting Information Figure 2. Scale bars = 50 nm in in A,B,D-H,J; 100 nm in C,I. |
|
|