
- Title
-
Modelling tuberculous meningitis in zebrafish using Mycobacterium marinum
- Authors
- van Leeuwen, L.M., van der Kuip, M., Youssef, S.A., de Bruin, A., Bitter, W., van Furth, A.M., van der Sar, A.M.
- Source
- Full text @ Dis. Model. Mech.
Granulomas in adult zebrafish after intraperitoneal infection. (A) Coronal section of adult zebrafish at 50 days after infection with M. marinum E11. Multifocal to coalescing granulomas (black arrows) affecting the meninges and submeningeal space structure can be seen, the brain parenchymal tissue (*) beneath the granulomas shows minimal lymphocytic inflammation, and the regional meningeal blood vessels are markedly congested (yellow arrow). Scale bar: 100 µm. Granuloma is enlarged in panels B and C. (B) Granulomas are composed of epithelioid and foamy macrophages (black arrow) that occasionally exhibited degeneration and necrosis (arrowheads). Scale bar: 20 µm. (C) Same granuloma as shown in panel B stained with ZN. Multiple acid-fast bacilli are present in the cytoplasm of the macrophages (black arrows). Scale bar: 20 µm. |
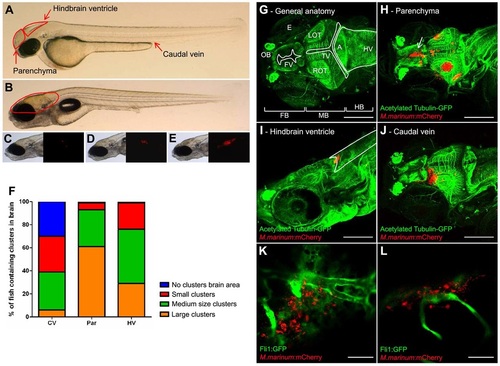
Three infection routes compared in the embryo model. (A) Photograph of a casper embryo at 2 dpf. Red arrows indicate the three different infection routes used. (B) Casper embryo at 7 dpf. The red line indicates the brain area. (C) Example of a small cluster. Left panel shows bright-field image; right panel shows corresponding fluorescent image. (D) Example of a medium cluster. (E) Example of a large cluster. (F) At 5 dpi, the infection was analyzed with fluorescence microscopy. Fluorescent bacterial clusters in the brain were counted visually. The clusters were scored, depending on their size, as small, medium or large. CV, caudal vein; Par, parenchyma; HV, hindbrain ventricle. (G–J) Z-stack of zebrafish embryos, at 7 dpf, stained with anti-acetylated tubulin (labelling axons; green) and infected with M. marinum E11 (red). Scale bars: 150 µm. (G) Anatomy of the zebrafish brain: FB, forebrain; MB, midbrain; HB, hindbrain; OT, optic tectum (L, left; R, right); OB, olfactory bulb; FV, forebrain ventricle; TV, tectal ventricle; HV, hindbrain ventricle; A, aquaductus; E, eye. (H) Embryo with multiple clusters after infection into the parenchyma. Arrow indicates a cluster in the ventricular wall. (I) Embryo infected into the hindbrain ventricle, with a cluster in the ventricle. Marked area indicates the hindbrain ventricle. (J) Embryo infected via the caudal vein, with a cluster in the parenchyma. (K,L) Tg(Fli1:GFP)y1 casper embryo (Fli1:GFP in green) at 5 days after infection via the caudal vein with M. marinum E11 (red). Both panels are single Z-slices and show the relationship between mycobacteria and blood vessels in the brain, which indicates migration of mycobacteria from bloodstream to brain tissue. Scale bars: 35 µm. |
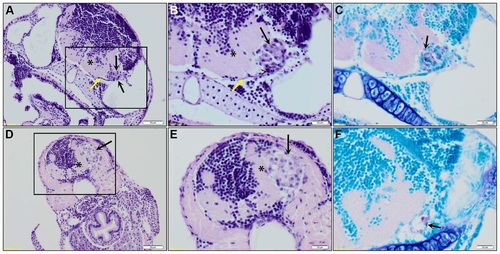
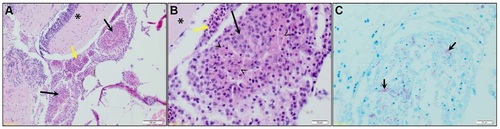
Histopathological analysis of granulomas in the brain of a zebrafish embryo. (A) Coronal section of an embryo (7 dpf; 5 days after infection with M. marinum E11) showing an early granuloma (black arrows) attached to the meninges (yellow arrow), causing impingement of the underlying brain parenchyma (*). Scale bar: 50 µm. Marked area is enlarged in panels B and C. (B) The early granuloma is composed of epithelioid macrophages (black arrow) and heterophils (arrowhead). (C) ZN stain of granuloma depicted in panel B showing the presence of acid-fast bacilli (black arrow). Scale bars: 20 µm. (D) Coronal section of an embryo (7 dpf; 5 days after infection with M. marinum E11) showing an early granuloma (black arrow) present in the submeningeal space causing severe impingement of the underlying brain parenchyma (*). Scale bar: 50 µm. Marked area is enlarged in panels E and F. (E) The early granuloma is composed of foamy macrophages (black arrow) and (F) shows moderate numbers of acid-fast bacilli (black arrow). Scale bars: 20 µm. |
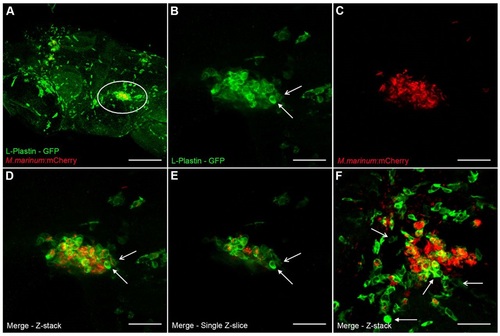
Composition of early granulomas. (A) Z-stack of the head of a zebrafish embryo (7 dpf) stained with anti-L-plastin, labeling phagocytic cells (green), infected with M. marinum E11 (red) via the caudal vein (5 dpi). Marked area is enlarged in panels B-E. (B-D) Z-stack of an early granuloma, with phagocytic cells stained with anti-L-plastin (B), M. marinum E11::mCherry (C) and merge (D). A phagocyte with high L-plastin intensity (closed arrow) and a phagocyte with low L-plastin intensity (open arrow) are depicted in panels B and D. (E) Single Z-slices of granuloma shows colocalization of phagocytes and mycobacteria. Arrows indicate different intensities of L-plastin, eliminating the possible effect of overlapping phagocytes in the Z-stack in panel B and D. (F) Z-stack of an early granuloma containing relatively more mycobacteria than phagocytes. Lots of phagocytes surrounding the cluster are probably still migrating to the cluster. The parenchymal infection route was used. Images were taken at 5 dpi. Scale bars: 150 µm (A), 35 µm (B-F). |
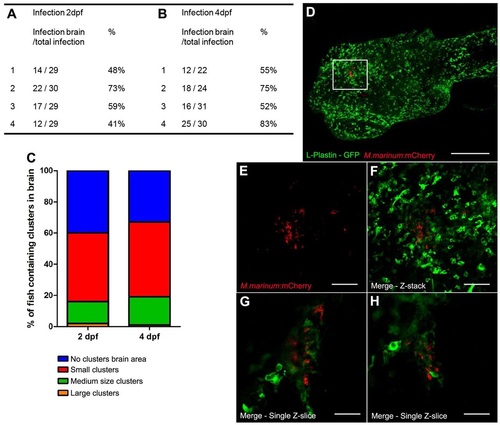
Presence of the blood-brain barrier. (A,B) Number of zebrafish embryos with bacteria in the brain area. Embryos were infected either before early BBB development (2 dpf) or after early BBB development (4 dpf) (four groups of embryos were used for each time point). No significant differences were found; P=0.3263. (C) Distribution of cluster size is shown as percentages of the total number of infected zebrafish. (D) Casper larvae (32 dpf) microinjected at 21 dpf with M. marinum E11 (red) in the heart. Analysis was performed at 11 dpi with anti-L-plastin staining (green). Marked area is enlarged in panels E-H. Scale bar: 300 µm. (E-G) Z-stack of cluster with a lot of phagocytic cells (single channel not shown), mycobacteria (E) and merge of both channels (F). Scale bars: 60 µm. (G,H) Single Z-slices at different Z-levels show colocalization of phagocytes and mycobacteria and cluster formation. Scale bar: 30 µm. |
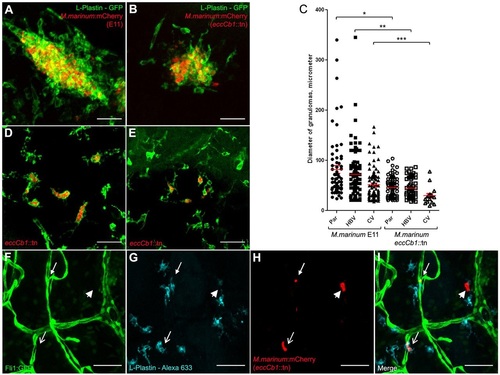
Role of the ESX-1 locus in the formation of early brain granulomas. (A) Example of a compact cluster with phagocytic cells and bacteria after infection into the parenchyma with M. marinum E11 (red), stained with anti-L-plastin (green). (B) Example of cluster after infection into the parenchyma with M. marinum eccCb1::tn (red), stained with anti-L-plastin (green). (C) Overview of diameter of individual granulomas counted in embryos infected via parenchyma (Par), hindbrain ventricle (HBV) or caudal vein (CV), with either M. marinum E11 or the isogenic eccCb1::tn mutant. The number of granulomas is described in Table 1. Par E11 versus Par F3.1: *P<0.0001, HBV E11 versus HBV F3.1: **P<0.0001, CV E11 versus CV F3.1: ***P=0.0135. (D) Example of single phagocytic cells filled with mycobacteria in an embryo infected into the parenchyma with eccCb1::tn mutant (red), stained with anti-L-plastin (green). (E) Example of single phagocytic cells filled with mycobacteria in an embryo infected via the caudal vein with eccCb1::tn mutant (red), stained with anti-L-plastin (green). Scale bars: 35 µm (A,B,D,E). (F-I) Z-stack of the relationship between vasculature, phagocytes and bacteria. Caudal vein infection with M. marinum eccCb1::tn mutant, with (F) Tg(Fli1:GFP)y1 casper embryo showing blood vessels, (G) L-plastin Alexa-Fluor-633 showing phagocytic cells and (H) eccCb1::mcherry showing bacteria. (I) Merge of panels F-H. Closed arrow indicates a phagocyte containing mycobacteria inside a blood vessel; open arrow indicates a phagocyte containing mycobacteria outside a blood vessel; arrowhead shows a bacterial cluster probably inside a dying phagocyte. Scale bars: 50 µm (F-I). EXPRESSION / LABELING:
|
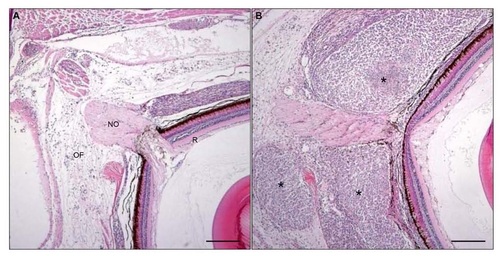
Orbital granulomas. [A] Normal anatomy of orbit and eye of adult zebrafish (NO = nervous opticus, R = retina, OF = orbital fat); [B] Large granulomatous mass (*) in the orbit affecting the optical nerve, after intraperitoneal infection with M. marinum; scale bar = 100 µm. |
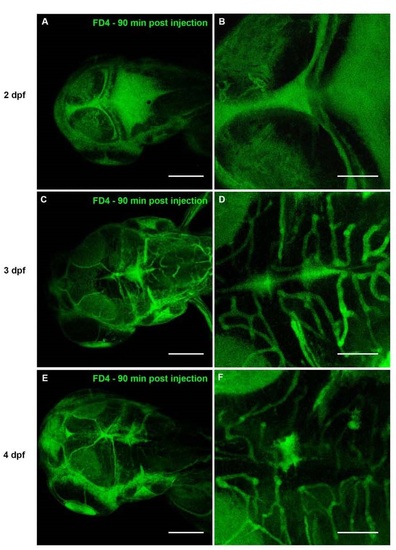
BBB functionality shown with FD4 (4 kDa) as a fluorescent tracer [A-B] Casper embryo, injected with fluorescent FD4 at 2 dpf via the caudal vein. Distribution of the tracer was monitored with confocal microscopy and shows leakage to the ventricles within the first 30 minutes post injection. [Panel A] Overview of the head of the embryo 90 minutes post injection with accumulation of the tracer in the ventricular system indicating that the BBB is not formed yet at this time point, scale bar = 150 µm, [Panel B] Enlargement of the midbrain ventricle and the hindbrain ventricle with dye accumulation, scale bar = 60 µm. [C-D] Casper embryo, injected with FD4 at 3 dpf via the caudal vein. [Panel C] Overview of the head of the embryo 90 minutes post injection. A clear pattern of the blood vessels is visible with minimal leakage of fluorescent dye to the ventricular system, Scale bar = 150 µm. [Panel D] Enlargement of Panel C, same region as Panel B, Scale bar = 60 µm. [E-F] Casper embryo, injected with FD4 at 4 dpf via the caudal vein. [Panel E] Overview of the head of the embryo 90 minutes post injection. A clear pattern of the blood vessels is visible without leakage of fluorescent dye to the ventricular system, indicating that the BBB is functional at 4 dpf in limiting traversal of molecules of 4 kDa and larger, scale bar = 150 µm. [Panel F] Enlargement of Panel E, same region as Panel B and D, scale bar = 60 µm. |