
|
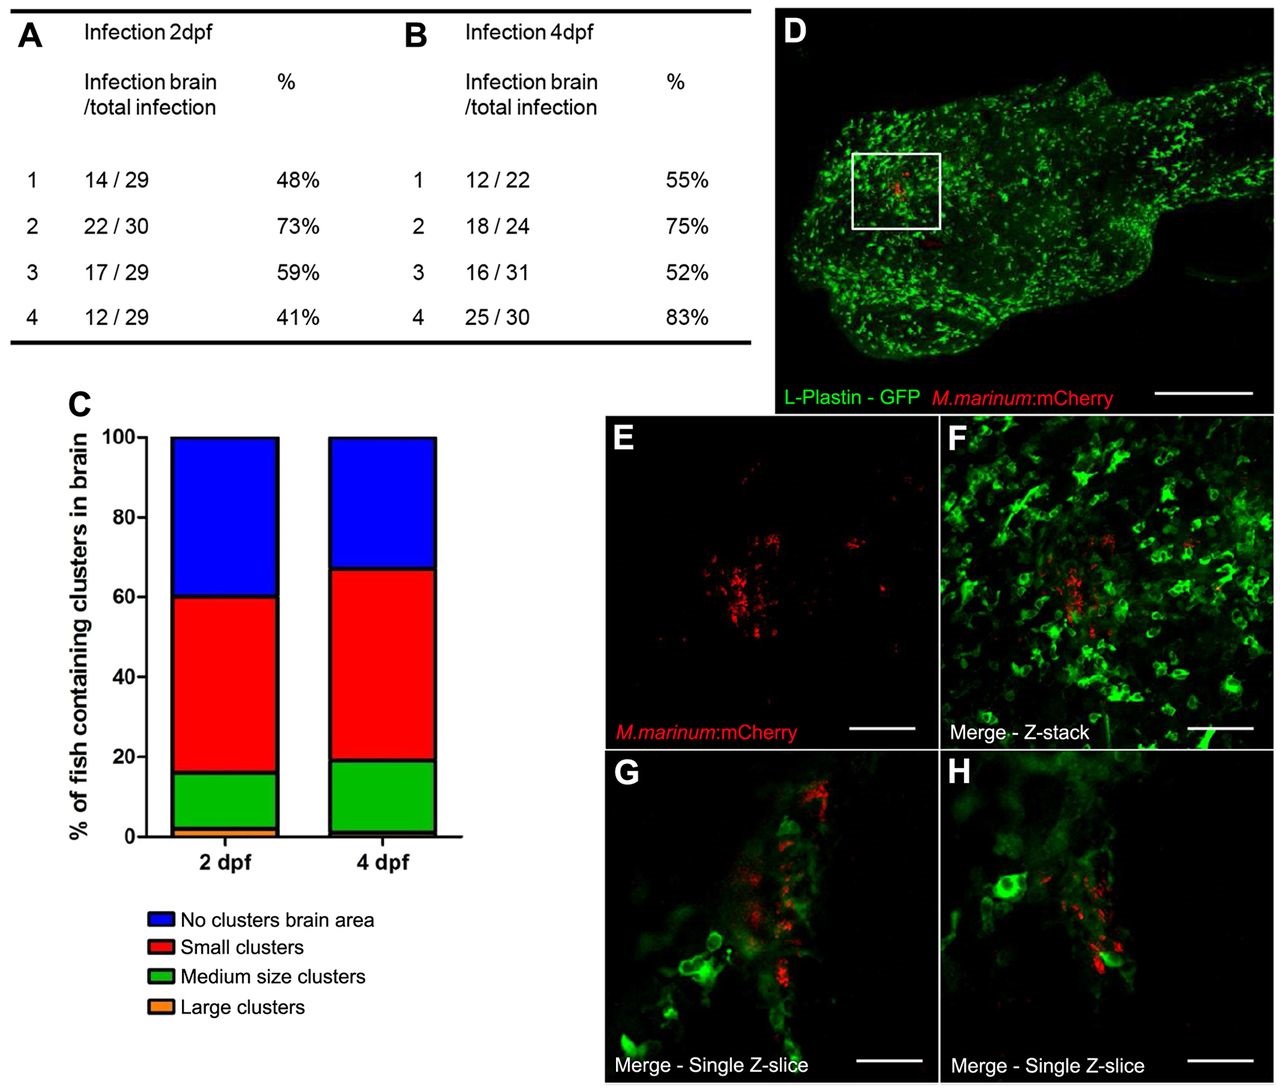
Fig. 5
Presence of the blood-brain barrier. (A,B) Number of zebrafish embryos with bacteria in the brain area. Embryos were infected either before early BBB development (2 dpf) or after early BBB development (4 dpf) (four groups of embryos were used for each time point). No significant differences were found; P=0.3263. (C) Distribution of cluster size is shown as percentages of the total number of infected zebrafish. (D) Casper larvae (32 dpf) microinjected at 21 dpf with M. marinum E11 (red) in the heart. Analysis was performed at 11 dpi with anti-L-plastin staining (green). Marked area is enlarged in panels E-H. Scale bar: 300 µm. (E-G) Z-stack of cluster with a lot of phagocytic cells (single channel not shown), mycobacteria (E) and merge of both channels (F). Scale bars: 60 µm. (G,H) Single Z-slices at different Z-levels show colocalization of phagocytes and mycobacteria and cluster formation. Scale bar: 30 µm.