
- Title
-
Dynamic gene expression by putative hair-cell progenitors during regeneration in the zebrafish lateral line
- Authors
- Steiner, A.B., Kim, T., Cabot, V., Hudspeth, A.J.
- Source
- Full text @ Proc. Natl. Acad. Sci. USA
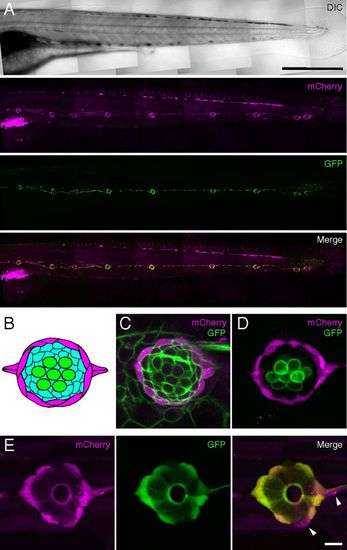
Expression of fluorescent proteins in mantle cells of the posterior lateral-line system. (A) Confocal mosaic images of a living alpl:mCherry;Et20 larva at 4 days postfertilization (dpf) demonstrate expression of mCherry (magenta) overlapping with that of GFP (green) in neuromasts and interneuromast cells. (Scale bar: 500 μm.) The same color code applies in C–E. (B) A neuromast comprises at least three cell types: hair cells (green), supporting cells (aqua), and mantle cells (magenta). (C) mCherry expression in alpl:mCherry larvae is limited to a subset of cells at the periphery of the neuromast. The image represents a confocal slice through a living alpl:mCherry; Tg(8.0cldnb:lynEGFP)zf106 larva, in which all cells of the neuromast express membrane-tethered GFP. (D) An alpl:mCherry;pou4f3:GFP animal expresses mCherry in peripheral cells, but that marker is excluded from hair cells that express membrane-tethered GFP instead. (E) mCherry and GFP have extensively overlapping but not identical expression patterns in mantle cells of alpl:mCherry;Et20 larvae. The arrowheads indicate two mCh+, GFP cells. (Scale bar: C–E, 10 μm.) EXPRESSION / LABELING:
|
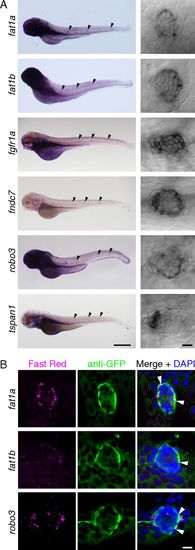
Confirmation by in situ hybridization of molecular markers for mantle cells. (A) As shown in low-magnification micrographs (Left; neuromasts indicated by black arrowheads) and confocal differential-interference-contrast images (Right), fat1a, fat1b, fgfr1a, fndc7, robo3, and tspan1 are expressed in neuromasts of the posterior lateral line. Note that each transcript is most prominent in a subset of cells at the periphery of the neuromast. (Scale bar: Left, 500 μm; Right, 10 μm.) (B) fat1a, fat1b, and robo3 each display a pattern of expression distinct from that of the Et20 transgene. FISH (Left; Fast Red) followed by immunofluorescent labeling of GFP (Middle) in Et20 larvae permits the comparison of each transcript’s expression pattern with transgenic GFP expression in mantle cells. (Right) Nuclei are labeled by DAPI. White arrowheads indicate colocalization of in situ labeling and anti-GFP immunofluorescence. (Scale bar: 10 μm.) EXPRESSION / LABELING:
|
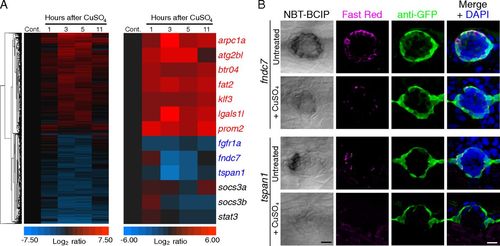
Transcriptional response of mantle cells to hair-cell destruction. (A) Extirpation of hair cells by the ototoxic chemical CuSO4 evokes the dynamic expression of select candidate genes in sorted mCh+ cells. Microarray results from samples dissected 1, 3, 5, and 11 h after treatment were normalized to those from untreated control samples (Cont.). (Left) Unsupervised hierarchical clustering of all of the genes whose expression was up- or down-regulated by at least a factor of 2 at some time after treatment, except genes whose expression also changed in NF cells. (Right) Genes of interest were selected on the basis of the degree and significance of differential expression as well as the availability of reliable annotation. The genes listed in blue were primarily down-regulated following hair-cell ablation, whereas those shown in red were principally up-regulated. The genes labeled in black were previously reported to be up-regulated in the sound-damaged zebrafish inner ear (42). (B) In situ hybridization supports the results from microarrays and reverse-transcription qPCR analyses: Both fndc7 and tspan1 are enriched in mantle cells and demonstrate reduced expression following CuSO4 treatment. The first column displays the results of chromogenic in situ hybridization; the second and third columns compare FISH (Fast Red) with GFP immunoreactivity (green) in Et20 larvae. The merged images in the fourth column include nuclear staining with DAPI (blue). (Scale bars: 10 μm.) EXPRESSION / LABELING:
|