
Fig. 3
|
Fig. 3
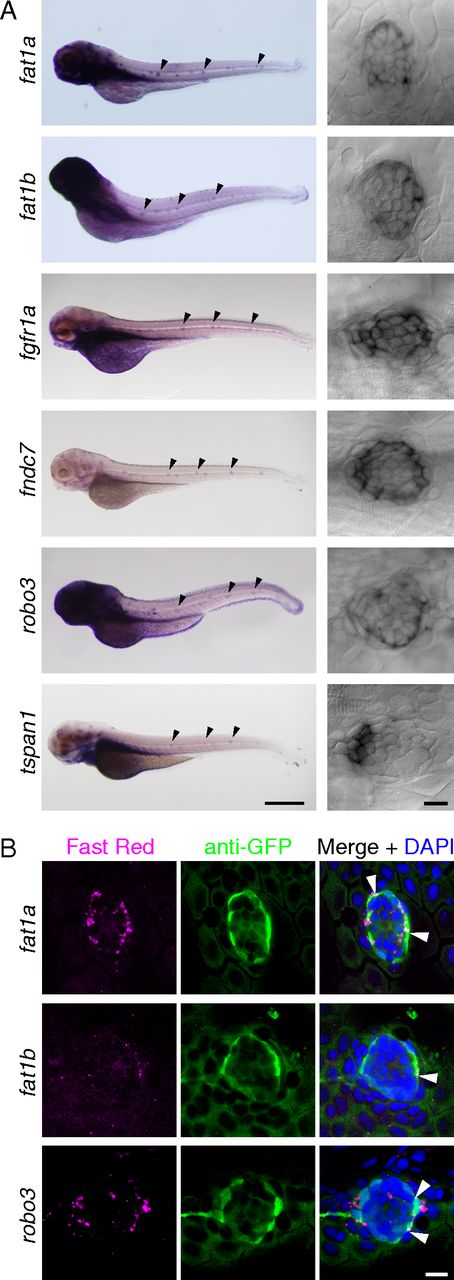
Confirmation by in situ hybridization of molecular markers for mantle cells. (A) As shown in low-magnification micrographs (Left; neuromasts indicated by black arrowheads) and confocal differential-interference-contrast images (Right), fat1a, fat1b, fgfr1a, fndc7, robo3, and tspan1 are expressed in neuromasts of the posterior lateral line. Note that each transcript is most prominent in a subset of cells at the periphery of the neuromast. (Scale bar: Left, 500 μm; Right, 10 μm.) (B) fat1a, fat1b, and robo3 each display a pattern of expression distinct from that of the Et20 transgene. FISH (Left; Fast Red) followed by immunofluorescent labeling of GFP (Middle) in Et20 larvae permits the comparison of each transcript’s expression pattern with transgenic GFP expression in mantle cells. (Right) Nuclei are labeled by DAPI. White arrowheads indicate colocalization of in situ labeling and anti-GFP immunofluorescence. (Scale bar: 10 μm.)