
- Title
-
Development of an Automated Imaging Pipeline for the Analysis of the Zebrafish Larval Kidney
- Authors
- Westhoff, J.H., Giselbrecht, S., Schmidts, M., Schindler, S., Beales, P.L., Tönshoff, B., Liebel, U., and Gehrig, J.
- Source
- Full text @ PLoS One
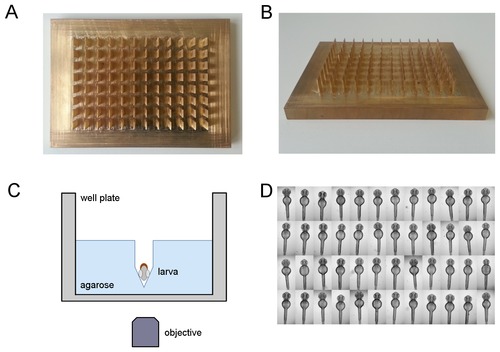
Standardized orientation of zebrafish embryos. (A,B) Photographs of the brass tool for the simultaneous generation of agarose grooves within 96 well microtiter plates: (A) top view and (B) tilted view. For dimensions of the plate see Materials and Methods section. (C) Schematic depiction of a single well with a ventrally oriented embryo within an agarose cavity. Drawing is not to scale. (D) Illustrative example of aligned and oriented embryos. Shown are dorsal views of 48 hpf embryos acquired using a 2.5x objective on an inverted wide field screening microscope. |
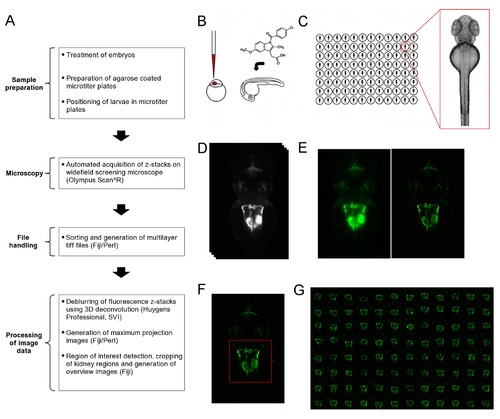
Overview of workflow for the automated imaging of the developing zebrafish pronephros. (A) Overview of the workflow for screening larval kidneys. The flowchart illustrates the different steps carried out to obtain overview images of kidneys. (B) Initial compound treatment or microinjection of embryos prior to sample preparation and imaging. (C) Schematic illustrating the transfer of embryos into agarose coated microtiter plates, and alignment and orientation of embryos. (D-G) Acquisition and processing of image Data. D to F show data of the same embryo. (D) Automated acquisition of z-stacks (33 z-slices, dZ=15μm) on an inverted widefield screening microscope. (E) Deblurring of images using deconvolution. Shown are maximum projections of z-stacks of raw data (left panel) and deconvolved data (right panel). (F) Automated detection and cropping of the kidney region. The red square indicates the position and dimensions of the cropped region. (G) Automated generation of overview images for quick assessment of overall morphological changes. Indomethacin skeletal formula in (A) taken from (http://en.wikipedia.org/wiki/File:Indometacin_skeletal.svg). |
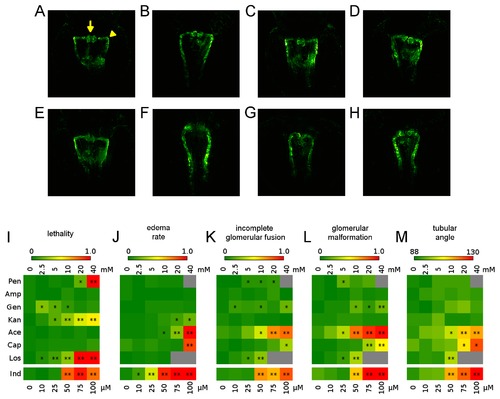
Overview of compound concentration-dependent pronephric phenotypes. Illustrative examples of pronephroi of a (A) non-treated embryo, and after treatment with (B) 20 mM penicillin, (C) 40 mM ampicillin, (D) 40 mM gentamicin, (E) 40 mM kanamycin, (F) 40 mM acetaminophen, (G) 40 mM captopril, (H) 10 mM losartan. For examples of phenotypes after Indomethacin treatment see Figure 4A-E. Arrow and arrowheads in (A) indicate the different morphological parameters of the pronephros scored to evaluate compound effect on the developing kidney. Arrow: fused glomeruli; Arrowhead: angle between the neck segment and the proximal convoluted tubule. (I-M) Heatmaps showing (I) lethality rates, (J) edema rates and (K-M) changes in morphological parameters of the pronephros. In detail, (K) incomplete glomerular fusion, (L) glomerular malformation and (M) tubular angle. For further details see Materials and Methods and Tables S1-S3. Colour codes indicate the percentage of embryos (I-L) with particular phenotype, or the angle between neck segment and proximal convoluted tubule (M) as indicated by the colour coded legend. Grey squares indicate missing data points. Concentration ranges used are indicated above the heatmaps, or below for Indomethacin, respectively. Abbreviations: penicillin (Pen), ampicillin (Amp), gentamicin (Gen), kanamycin (Kan), acetaminophen (Ace), captopril (Cap), losartan (Los) and indomethacin (Ind). *p<0.05, **p<0.001. |
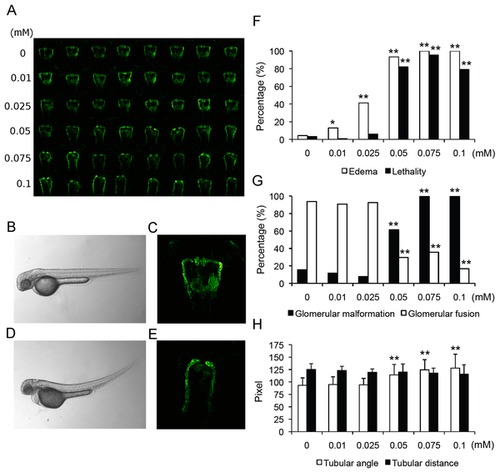
Impairment of pronephros development upon indomethacin treatment. (A) Overview of pronephric alterations in zebrafish larvae (50 hpf) following indomethacin administration for 24 hours. Row 1 shows control embryos, rows 2-6 zebrafish embryos following indomethacin administration in increasing concentrations (row 2, 0.01 mM; row 3, 0.025 mM; row 4, 0.05 mM; row 5, 0.075 mM and row 6, 0.1 mM). (B-E) Comparison of (B-C) 50 hpf control larva and (D-E) indomethacin (0.1 mM) treated larva. (D) Brightfield image shows edema formation following indomethacin administration. (E) Fluorescence image showing nephron (glomerular and tubular) malformation. (F) Quantification of lethality rates and edema formation following indomethacin administration. (G) Concentration-dependent increases in glomerular malformation and decreases in glomerular fusion rates following indomethacin administration. (H) Widened tubular angles between neck segment and proximal convoluted tubule following indomethacin administration. Data are shown as mean ± SD. *p<0.05, **p<0.001. |
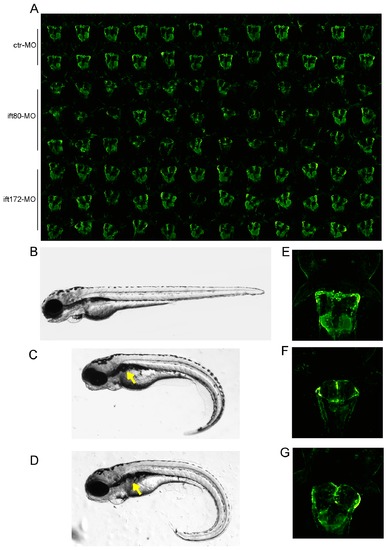
Detection of cystic kidneys after Ift80 and Ift172 knockdown. (A) Automatically generated overview thumbnail image of 96 kidneys of morpholino injected larvae: standard ctr-MO (row 1-2), ift80-MO (row 3-5) and ift172-MO (row 6-8). (B-D) Phenotypic alterations of zebrafish larvae at 4 dpf after morpholino microinjection; (C) ift80-MO and (D) ift172-MO injected embryos exhibit glomerular cyst (arrow) and a ventrally curved tail compared to (B) standard ctr-MO injected embryos. (E-G) In-detail visualisation of glomerular cysts at 72 hpf in (F) ift80-MO and (G) ift172-MO injected embryos compared to standard ctr-MO injected embryos (E) using the Tg(wt1b:EGFP) transgenic line. |
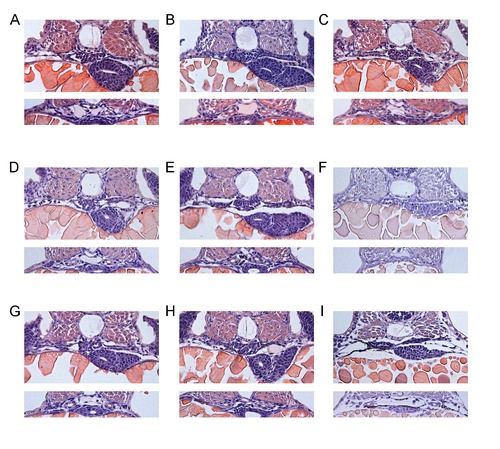
Cross-sections of pronephric regions after compound exposure. Shown are glomerular (upper panels) and tubular (lower panels) sections at 48 hours post fertilization. (A) control, (B) penicillin (20 mM), (C) ampicillin (40 mM), (D) gentamicin (40 mM), (E) kanamycin (40 mM), (F) acetaminophen (40 mM), (G) captopril (40 mM), (H) losartan (10 mM) and (I) indomethacin (0.75 mM) treatment. |
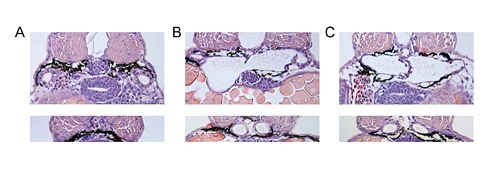
Cross-sections of pronephric regions after morpholino injections. Shown are glomerular (upper panels) and tubular (lower panels) sections at 72 hours post fertilization. (A) control-MO, (B) ift80-MO and (C) ift172-MO injection. |