
|
Fig. 4
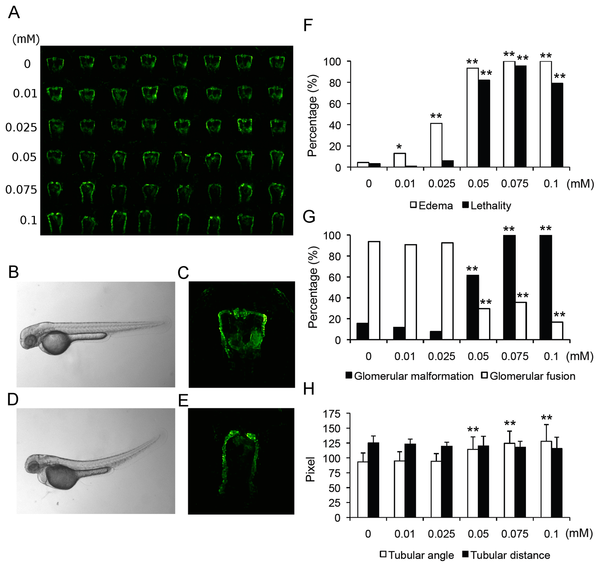
Impairment of pronephros development upon indomethacin treatment.
(A) Overview of pronephric alterations in zebrafish larvae (50 hpf) following indomethacin administration for 24 hours. Row 1 shows control embryos, rows 2-6 zebrafish embryos following indomethacin administration in increasing concentrations (row 2, 0.01 mM; row 3, 0.025 mM; row 4, 0.05 mM; row 5, 0.075 mM and row 6, 0.1 mM). (B-E) Comparison of (B-C) 50 hpf control larva and (D-E) indomethacin (0.1 mM) treated larva. (D) Brightfield image shows edema formation following indomethacin administration. (E) Fluorescence image showing nephron (glomerular and tubular) malformation. (F) Quantification of lethality rates and edema formation following indomethacin administration. (G) Concentration-dependent increases in glomerular malformation and decreases in glomerular fusion rates following indomethacin administration. (H) Widened tubular angles between neck segment and proximal convoluted tubule following indomethacin administration. Data are shown as mean ± SD. *p<0.05, **p<0.001.