
Fig. 2
- ID
- ZDB-FIG-140204-46
- Publication
- Westhoff et al., 2013 - Development of an Automated Imaging Pipeline for the Analysis of the Zebrafish Larval Kidney
- Other Figures
- All Figure Page
- Back to All Figure Page
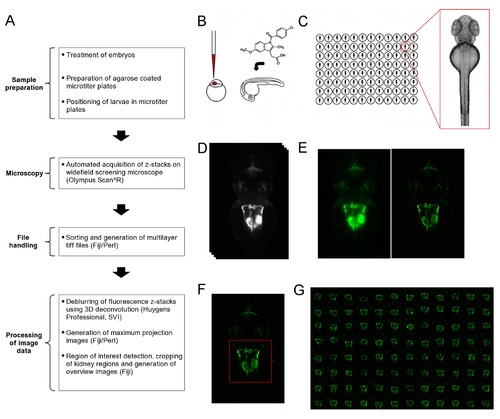
Overview of workflow for the automated imaging of the developing zebrafish pronephros. (A) Overview of the workflow for screening larval kidneys. The flowchart illustrates the different steps carried out to obtain overview images of kidneys. (B) Initial compound treatment or microinjection of embryos prior to sample preparation and imaging. (C) Schematic illustrating the transfer of embryos into agarose coated microtiter plates, and alignment and orientation of embryos. (D-G) Acquisition and processing of image Data. D to F show data of the same embryo. (D) Automated acquisition of z-stacks (33 z-slices, dZ=15μm) on an inverted widefield screening microscope. (E) Deblurring of images using deconvolution. Shown are maximum projections of z-stacks of raw data (left panel) and deconvolved data (right panel). (F) Automated detection and cropping of the kidney region. The red square indicates the position and dimensions of the cropped region. (G) Automated generation of overview images for quick assessment of overall morphological changes. Indomethacin skeletal formula in (A) taken from (http://en.wikipedia.org/wiki/File:Indometacin_skeletal.svg). |