
- Title
-
Pulse propagation by a capacitive mechanism drives embryonic blood flow
- Authors
- Anton, H., Harlepp, S., Ramspacher, C., Wu, D., Monduc, F., Bhat, S., Liebling, M., Paoletti, C., Charvin, G., Freund, J.B., and Vermot, J.
- Source
- Full text @ Development
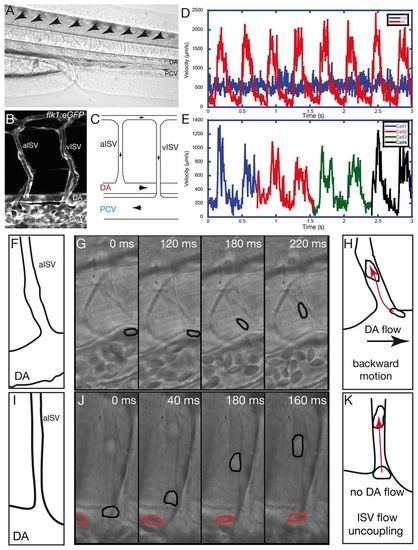
Blood cell motions demonstrate flow rectification and an additional force at the ISV entry of the embryonic vascular network. (A) Lateral view of the zebrafish larvae at 72 hpf. Blood vessels of the tail are visible in the focal plane. Blood cells are present in the dorsal aorta (DA) and the posterior cardinal vein (PCV). Arrows indicate the intersegmental vessels (ISV). (B) View of a typical vascular loop between the DA and the PCV through z projection of a confocal stack obtained with the Tg(flk1:eGFP) transgenic line expressing the EGFP specifically in the endothelial cells. Arterial ISV (aISV) and venous ISV (vISV) are labeled. (C) A typical vascular loop observed in the trunk vasculature with the black arrows indicating the direction of blood flow. The blood cells in the DA enter into the aISV, pass in to vISV and move towards the PCV and the heart. (D) Typical velocity profile of the blood cells circulating in the DA (red) and PCV (blue). The DA displays a pulsatile flow, whereas the PCV flow is relatively steady. (E) Typical velocity pattern of blood cells observed in the ISV. Flow is pulsatile but not fully synchronized with the DA flow. (F-K) Fast imaging of blood cell motion at the ISV entry. (F) The observed topography at the ISV entry in G. (G) Fast time-lapse imaging showing a blood cell (outlined in black) moving against the DA flow towards the ISV. (H) Summary of the backward blood cell motion towards the ISV (red arrow) as opposed to DA flow (black arrow). (I) The observed topography at the ISV entry in J. (J) Fast time-lapse imaging showing blood cell displacement in the ISV (outlined in black) is much greater than in the DA (outlined in red). (K) Summary of the additional cell motion within the ISV (red arrow) when there is no visible DA flow. |
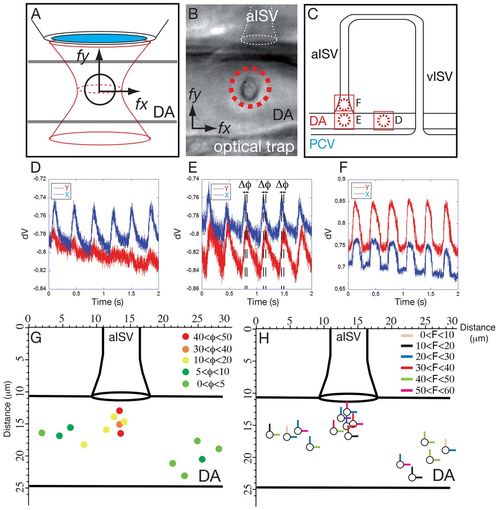
Blood cell attraction towards the ISV follows two oscillatory phase-shifted forces. (A,B) Schematic representation (A) and in vivo live image (B) to detail the optical tweezing experiments undertaken to characterize blood cell motion near the ISV entry. Detection of the constrained blood cell motion within the optical tweezer reflects the effects of surrounding flow forces. The reconstruction of the displacement along the x and y axes allowed us to decipher the force applied to the cell (fx and fy). (C) In vivo, blood cells are trapped at different positions in the DA near and at the ISV entry, with dotted red circles representing the immobilizing focus of the optical tweezer in the same embryo (B,C). The corresponding motion patterns are shown in D-F. (D-F) Real-time blood cell displacement (represented by the signal from the quadrative detector, dV) is plotted as a function of time, illustrating the typical motion resulting from blood flow. When blood cells are positioned in the DA away from the ISV, the displacement along the x-axis is predominant, showing the effect of pulsatile flow in the DA (D). When positioned near the ISV entry, an additional motion in Y is observed that is always out of phase from the X direction (Δφ) (E). The attractive force is thus oscillating and is not fully coupled with DA flow. When positioned in the ISV, blood cell motion in X and Y directions are in phase again (F). (G) Phase-shift (Δφ) mapping at the ISV entry demonstrates the attractive force is correlated with the proximity to the ISV entry and shows the XY correlation decrease when closer to the ISV. (H) Force map in pN obtained after optical-tweezer measurement. The maps in G and H were obtained by analysing three different embryos. |
Blood cell attraction towards the ISV follows two oscillatory phase-shifted forces. (A,B) Schematic representation (A) and in vivo live image (B) to detail the optical tweezing experiments undertaken to characterize blood cell motion near the ISV entry. Detection of the constrained blood cell motion within the optical tweezer reflects the effects of surrounding flow forces. The reconstruction of the displacement along the x and y axes allowed us to decipher the force applied to the cell (fx and fy). (C) In vivo, blood cells are trapped at different positions in the DA near and at the ISV entry, with dotted red circles representing the immobilizing focus of the optical tweezer in the same embryo (B,C). The corresponding motion patterns are shown in D-F. (D-F) Real-time blood cell displacement (represented by the signal from the quadrative detector, dV) is plotted as a function of time, illustrating the typical motion resulting from blood flow. When blood cells are positioned in the DA away from the ISV, the displacement along the x-axis is predominant, showing the effect of pulsatile flow in the DA (D). When positioned near the ISV entry, an additional motion in Y is observed that is always out of phase from the X direction (Δφ) (E). The attractive force is thus oscillating and is not fully coupled with DA flow. When positioned in the ISV, blood cell motion in X and Y directions are in phase again (F). (G) Phase-shift (Δφ) mapping at the ISV entry demonstrates the attractive force is correlated with the proximity to the ISV entry and shows the XY correlation decrease when closer to the ISV. (H) Force map in pN obtained after optical-tweezer measurement. The maps in G and H were obtained by analysing three different embryos. |
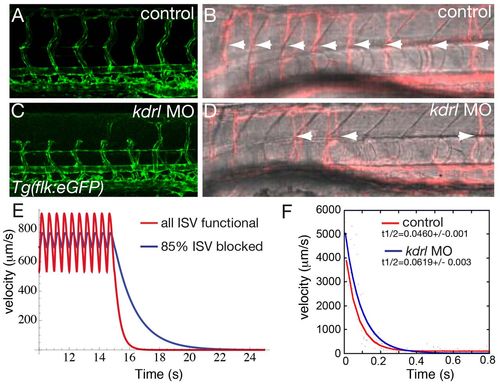
The viscous resistance of the ISV flow sets the time scale of the flow decay after heart stops. (A-D) Visualization of the vascular network shape Tg(flk1:eGFP) (A,C) and ISVs with active flow [appearing in pink (false color) after standard deviation projection] (B,D) in controls (A,B) and kdrl knock down (C,D) at 3 dpf. White arrowheads indicate active ISVs. (E) Plot of the simulated experiment. The heart stops at t=15 seconds for both cases. The axes are flow velocity in μm/second versus time for control (red curve), where all the a/vISV are functional and mutants (blue curve) where 85% of the a/vISV are blocked (zero diameter). (F) Example of plots observed for the flow decay after heart stop in one control (red) and one kdrl knockdown (blue) embryo. |
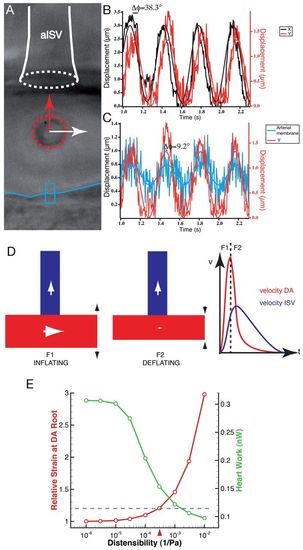
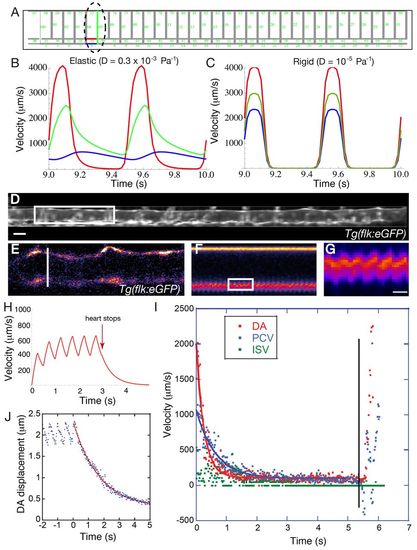
Dynamic capacitive mechanism in the embryonic vascular network. (A) Optical tweezing at the aISV entry in the embryo. The trapped blood cell is outlined by the red dotted circle. The arrows highlight the directions of motion in X (white arrow) and Y (red arrow) of the blood cell. The ISV entry is labeled as a white dotted circle and the blue line labels the ventral DA wall. (B) Plot of the oscillations over time in X and Y at the trap point shown in A in the same embryo. (C) Plot of the oscillations over time in Y at the trap point shown in A (red line) along with oscillation of the DA cell wall (blue line). The tracked wall corresponds to the blue box in A. The motion towards the ISV is correlated with the DA wall oscillations, showing that the force driving blood cells towards the ISV is coupled with the cyclical deformation of the DA. (D) A model for vascular flow at early embryonic stages showing that distensibility of the DA maintains flow in the ISV after heart contraction through its own deflation. The flow direction is labeled with arrows. A first force is needed to inflate the DA (F1) and, as a result of deflation, a second force (F2) is generated that maintains flow steady in the ISV. The observed DA and ISV velocities are plotted according to the force (F1 and F2). (E) Heart effort (plotted in green, right y-axis) and strain at the DA root (plotted in red, left y-axis) as a function of the distensibility. Heart effort decreases as elasticity increases. The horizontal blue bar indicates the theoretical strain limit at which vessel will break. The red arrow indicates the measured distensibility, which corresponds to strain of 20%, which is often considered large but not damaging to tissues, suggesting the DA distensibility is optimized near the rupture limit for lowering heart work. |
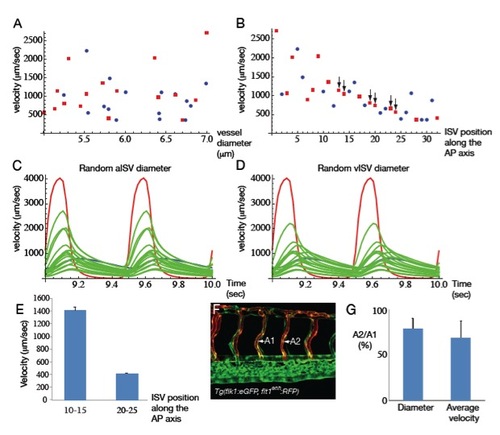
Validation of the model. (A) Plot showing the ISV peak velocity during cardiac cycle versus lumen inner diameter. (B) Plot showing ISV peak velocity during cardiac cycle versus ISV number from head. Red squares: ISA, blue circles: ISV. (C-D) plot of the DA flow (red), PCV flow (blue), aISV flow (green) (C) vISV flow (green) (D). All the ISVs along the AP axis are represented to show the global variability amongst ISV. Yet the ISV flow in general decrease along the AP axis (see also B). (E) In vivo ISV flow measurements showing that posterior ISV flow (ISV 20-25) has lower velocity than anterior (ISV 10-15) as expected from the model (B). (F-G) Flow measured in successive aISV identified by Tg(flt1enh:RFP) expression. (F) a1ISV flow is higher than a2ISV when two successive ISVs have an arterial identity. This effect is also observed in the simulation (black arrows in B). |