
Fig. 4
- ID
- ZDB-FIG-140107-27
- Publication
- Anton et al., 2013 - Pulse propagation by a capacitive mechanism drives embryonic blood flow
- Other Figures
- All Figure Page
- Back to All Figure Page
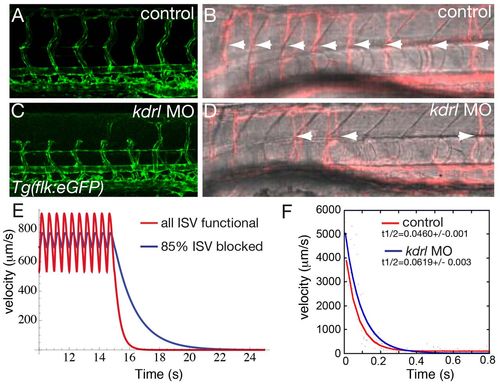
The viscous resistance of the ISV flow sets the time scale of the flow decay after heart stops. (A-D) Visualization of the vascular network shape Tg(flk1:eGFP) (A,C) and ISVs with active flow [appearing in pink (false color) after standard deviation projection] (B,D) in controls (A,B) and kdrl knock down (C,D) at 3 dpf. White arrowheads indicate active ISVs. (E) Plot of the simulated experiment. The heart stops at t=15 seconds for both cases. The axes are flow velocity in μm/second versus time for control (red curve), where all the a/vISV are functional and mutants (blue curve) where 85% of the a/vISV are blocked (zero diameter). (F) Example of plots observed for the flow decay after heart stop in one control (red) and one kdrl knockdown (blue) embryo. |