
Fig. 5
- ID
- ZDB-FIG-140107-28
- Publication
- Anton et al., 2013 - Pulse propagation by a capacitive mechanism drives embryonic blood flow
- Other Figures
- All Figure Page
- Back to All Figure Page
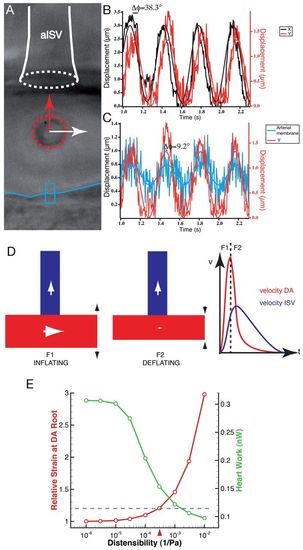
Dynamic capacitive mechanism in the embryonic vascular network. (A) Optical tweezing at the aISV entry in the embryo. The trapped blood cell is outlined by the red dotted circle. The arrows highlight the directions of motion in X (white arrow) and Y (red arrow) of the blood cell. The ISV entry is labeled as a white dotted circle and the blue line labels the ventral DA wall. (B) Plot of the oscillations over time in X and Y at the trap point shown in A in the same embryo. (C) Plot of the oscillations over time in Y at the trap point shown in A (red line) along with oscillation of the DA cell wall (blue line). The tracked wall corresponds to the blue box in A. The motion towards the ISV is correlated with the DA wall oscillations, showing that the force driving blood cells towards the ISV is coupled with the cyclical deformation of the DA. (D) A model for vascular flow at early embryonic stages showing that distensibility of the DA maintains flow in the ISV after heart contraction through its own deflation. The flow direction is labeled with arrows. A first force is needed to inflate the DA (F1) and, as a result of deflation, a second force (F2) is generated that maintains flow steady in the ISV. The observed DA and ISV velocities are plotted according to the force (F1 and F2). (E) Heart effort (plotted in green, right y-axis) and strain at the DA root (plotted in red, left y-axis) as a function of the distensibility. Heart effort decreases as elasticity increases. The horizontal blue bar indicates the theoretical strain limit at which vessel will break. The red arrow indicates the measured distensibility, which corresponds to strain of 20%, which is often considered large but not damaging to tissues, suggesting the DA distensibility is optimized near the rupture limit for lowering heart work. |