
Fig. S1
- ID
- ZDB-FIG-140107-23
- Publication
- Anton et al., 2013 - Pulse propagation by a capacitive mechanism drives embryonic blood flow
- Other Figures
- All Figure Page
- Back to All Figure Page
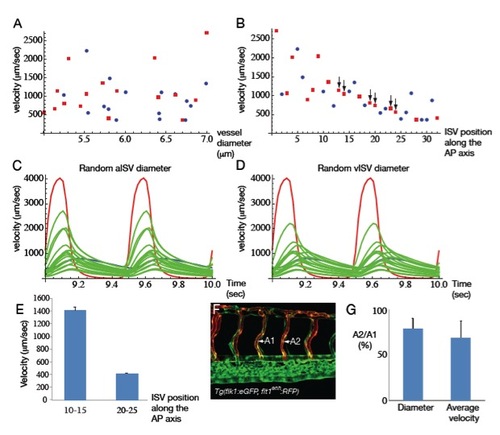
Validation of the model. (A) Plot showing the ISV peak velocity during cardiac cycle versus lumen inner diameter. (B) Plot showing ISV peak velocity during cardiac cycle versus ISV number from head. Red squares: ISA, blue circles: ISV. (C-D) plot of the DA flow (red), PCV flow (blue), aISV flow (green) (C) vISV flow (green) (D). All the ISVs along the AP axis are represented to show the global variability amongst ISV. Yet the ISV flow in general decrease along the AP axis (see also B). (E) In vivo ISV flow measurements showing that posterior ISV flow (ISV 20-25) has lower velocity than anterior (ISV 10-15) as expected from the model (B). (F-G) Flow measured in successive aISV identified by Tg(flt1enh:RFP) expression. (F) a1ISV flow is higher than a2ISV when two successive ISVs have an arterial identity. This effect is also observed in the simulation (black arrows in B). |