
- Title
-
Loss of Pten promotes angiogenesis and enhanced vegfaa expression in zebrafish
- Authors
- Choorapoikayil, S., Weijts, B., Kers, R., de Bruin, A., and den Hertog, J.
- Source
- Full text @ Dis. Model. Mech.
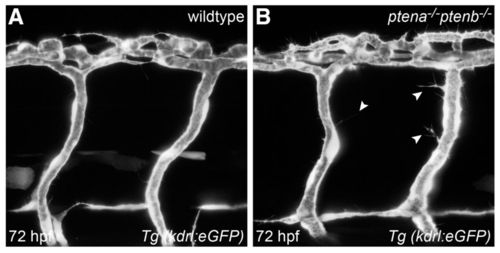
Loss of Ptena and Ptenb leads to excessive filopodia formation in endothelial cells at 72 hpf. Endothelial cells in living wild-type (A) and ptena-/-ptenb-/- mutant (B) embryos were visualized using Tg(kdrl:eGFP) and confocal imaging was performed at 70–72 hpf. Intersegmental vessels along the trunk in ptena-/-ptenb-/- mutants (4/4) show excessive filopodia formation (arrowheads), whereas no filopodia were observed in wild-type (0/4) embryos. Anterior to the left, 40× + 1.5 zoom, 0.5 μm step size. EXPRESSION / LABELING:
PHENOTYPE:
|
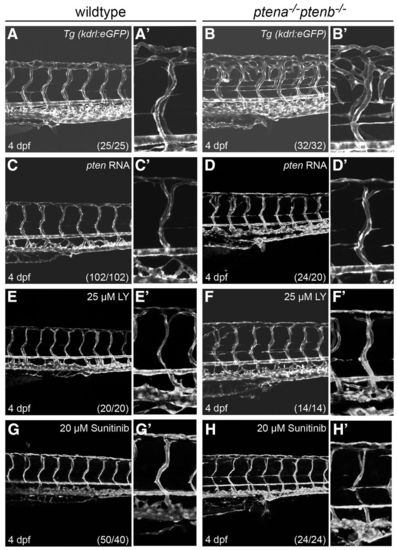
Rescue of enhanced angiogenesis in ptena-/-ptenb-/- mutants by exogenous ptena mRNA, LY294002 or sunitinib. The transgenic line, Tg(kdrl:eGFP), was used to visualize the vasculature at 4 dpf in wild-type (A,C,E,G) and ptena-/-ptenb-/- (B,D,F,H) embryos. Close-ups of the intersegmental vessel above the urogenital opening are shown in adjacent panels. (A–B2) ptena-/-ptenb-/- mutants display ectopic vessel growth compared with wild-type embryos. (C–D2) 10 pg synthetic ptena mRNA was injected at the one-cell stage into wild-type and ptena-/-ptenb-/- embryos. (E–F2) 25 μM LY294002 (LY) was applied from 70–72 hpf onwards. (G–H2) 20 μM sunitinib was applied from 70–72 hpf onwards. Images were taken using a confocal microscope with 20×. The numbers in the bottom right corner represent the total number of embryos treated/the number of embryos showing the phenotype depicted here. Anterior to the left, 20×, 2 μm step size. |
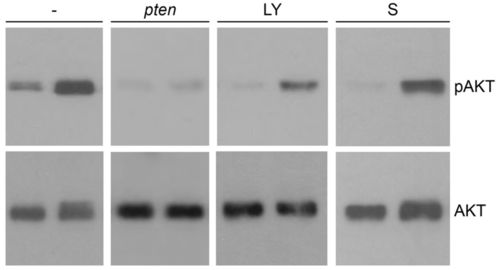
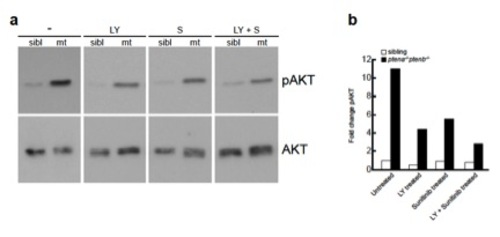
Elevated pAkt level in ptena-/-ptenb-/- mutants is suppressed by LY294002 and to a lesser extent by sunitinib. Wild-type (left lane of each blot) and ptena-/-ptenb-/- mutant (right lane of each blot) embryos were left untreated (-), were injected at the one-cell stage with ptena mRNA (pten), or were treated with 25 μM LY294002 (LY) or 20 μM sunitinib (S) from 72 hpf onwards. Single embryos were lysed at 4 dpf and the protein from individual embryos was isolated. The proteins were run on a denaturing SDS-polyacrylamide gel and transferred to PVDF membranes. After blocking, the blot was probed with phosphospecific anti-pAkt antibody (directed against pSer473), stripped and probed with Akt-specific antibody as a loading control. The number of individual embryos that were analyzed is: wild type, 24; mutant, 23; wild type + pten, 10; mutant + pten, 15; wild type + LY, 2; mutant + LY, 6; wild type + S, 5; mutant + S, 5. Representative blots are depicted here. The intensities of the bands were quantified (supplementary material Fig. S5). |
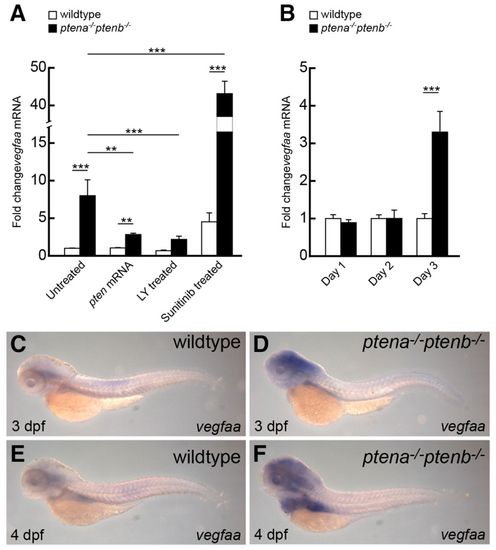
Upregulated vegfaa expression in ptena-/-ptenb-/- mutants is diminished by LY294002 and enhanced by sunitinib. (A,B) Quantitative PCR was performed to determine vegfaa expression levels in ptena-/-ptenb-/- mutants compared with wild type at 4 dpf (A) and at 1, 2 and 3 dpf (B). Rescue experiments were done by microinjection of ptena mRNA at the one-cell stage or by treatment with 25 μM LY294002 (LY) or 20 μM sunitinib from 72 hpf onwards. Wild-type control was set to 1 and all values were determined relative to the wild-type control at 3 dpf. Three embryos were pooled per condition and the data represent the results of at least two independent experiments. Statistical analysis (Kruskal-Wallis with Dunn’s post-hoc test) was performed using Excel and SPSS 20 (IBM); significance is indicated: **P<0.01; ***P<0.001. Note that the y-axis is discontinuous to accommodate the 40-fold increase in vegfaa expression upon sunitinib treatment of ptena-/-ptenb-/- mutants. (C–F) In situ hybridization was performed with a vegfaa-specific probe on 3-dpf or 4-dpf wild-type and ptena-/-ptenb-/- mutant embryos, as indicated. The number of embryos analyzed is: wild type 3 dpf, 6; wild type 4 dpf, 4; ptena-/-ptenb-/- 3 dpf, 4; ptena-/-ptenb-/- 4 dpf, 5. Representative pictures are depicted here. Pictures were taken with a 4.5× objective. EXPRESSION / LABELING:
|
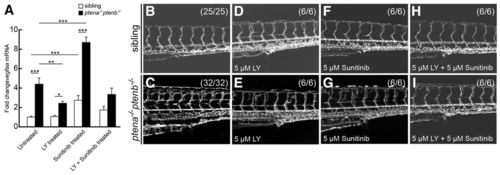
Combined treatment with LY294002 and sunitinib rescued hypervascularization. (A) Quantitative PCR was performed to determine vegfaa expression at 4 dpf in ptena-/-ptenb-/- mutants compared with siblings following treatment with suboptimal concentrations of LY294002 (LY, 5 μM) or sunitinib (5 μM), or both, from 72 hpf onwards. Three embryos per condition were pooled and used for quantitative PCR; at least two independent experiments were performed. Relative amounts were determined with wild type untreated set to 1.0. Statistical analysis (Kruskal-Wallis with Dunn’s post-hoc test) was performed using Excel and SPSS 20 (IBM); significance is indicated: **P<0.01; ***P<0.001. (B–I) Vasculature of wild-type and ptena-/-ptenb-/- embryos at 4 dpf was imaged in the Tg(kdrl:eGFP) line by confocal microscope with 20×. The embryos were treated with suboptimal concentrations of LY294002 (LY), sunitinib or both as indicated. Representative embryos are depicted; anterior to the left. |
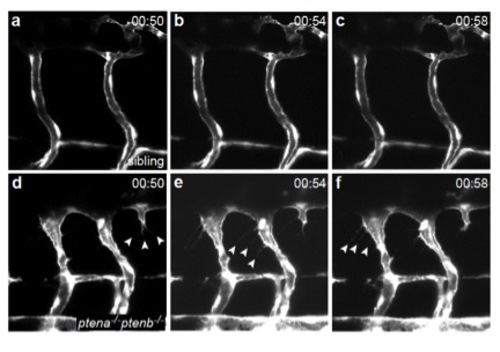
Endothelial cells lacking Pten display protruding filopodia from 75 hpf onwards. Still frames from time lapse movies of Tg(kdrl:eGFP) sibling (Suppl Mov 1, panel a-c) and ptena-/-ptenb-/- mutant embryo (Suppl Mov 2, panel d-f) showing two intersegmental vessels in the trunk of the embryo. Endothelial cells in ptena-/-ptenb-/- mutants display filopodia formation (arrowheads), whereas endothelial cells in siblings do not. Images were taken every 2 minutes, maximum projections of z-stacks (1 μm step size) were used to generate the time lapse movies. Anterior to the left, 40x with 2 zoom, time is indicated in hours and minutes. |
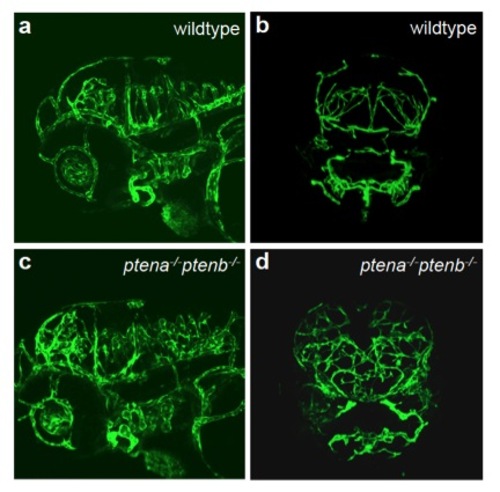
Enhanced angiogenesis in head vasculature in ptena-/-ptenb-/- mutant embryos Endothelial cells in wildtype (a, b) and ptena-/-ptenb-/- mutants (c, d) were visualized using Tg(kdrl:eGFP) by confocal imaging at 4 dpf. Anterior to the left, 20x, 2 μm step size, lateral (a, c) and sagittal (b, d) view. |
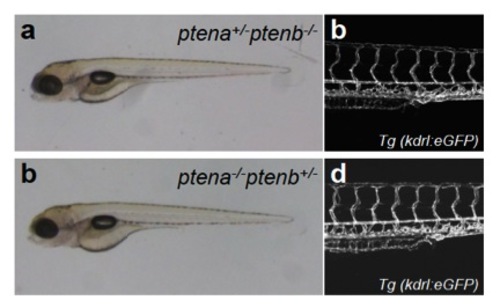
Morphology and vasculature are not perturbed in ptena+-/-ptenb-/- or ptena-/-ptenb+/- mutants. The morphology (a, c) and vasculature (b, d) was visualized in ptena+-/-ptenb-/- (a,b) and ptena-/-ptenb+/- (c,d) mutants by (confocal) microscopy using Tg(kdrl:eGFP) at 4 dpf. No defects were observed in mutants. Anterior to the left, 20x, 2 μm step size.
|
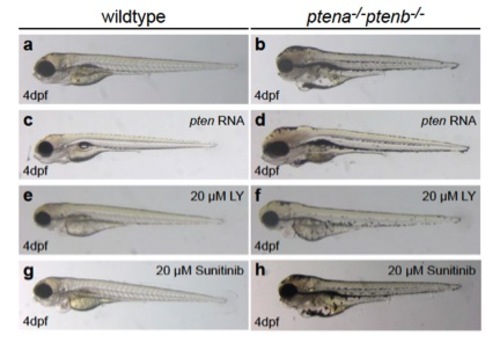
Rescue of morphological defects in ptena-/-ptenb-/- mutants by exogenous Ptena, LY294002 and Sunitinib. At 4 dpf ptena-/-ptenb-/- mutants display severe morphological defects compared to wildtype (a, b): head and eye edema, wider set eyes, enlargement of yolk sac, reduced body length. Expression of exogenous Ptena did not cause malformation in development of wildtype embryo, but largely rescued the developmental defects in ptena-/-ptenb-/- mutants (c, d). Treatment of embryos from 72 hpf onwards with 25 μM LY294002 resulted in mild growth defects in the head region in wildtype embryos and almost complete rescue of developmental defects in ptena-/-ptenb-/- mutants (e,f). Treatment with 20 μM Sunitinib from 72 hpf onwards did not induce obvious morphological defects in wildtype embryos and largely rescued the morphological malformations in ptena-/-ptenb-/- mutants (g,h). |
Combined treatment with suboptimal concentration of LY294002 and Sunitinib leads to mild down regulation of pAkt compared to non-treated Pten mutant embryos |