
- Title
-
Ubiad1 Is an Antioxidant Enzyme that Regulates eNOS Activity by CoQ10 Synthesis
- Authors
- Mugoni, V., Postel, R., Catanzaro, V., De Luca, E., Turco, E., Digilio, G., Silengo, L., Murphy, M.P., Medana, C., Stainier, D.Y., Bakkers, J., and Santoro, M.M.
- Source
- Full text @ Cell
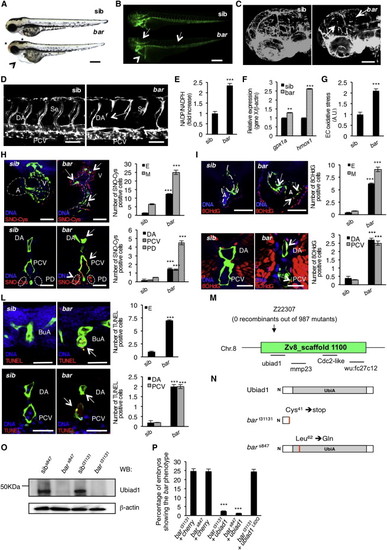
Loss of Ubiad1 Induces Cardiovascular Failure in Zebrafish Embryos by Increasing Oxidative Stress(A and B) Siblings (sib) and barolot31131 (bar) mutant embryos at 65 hpf. (A) Vascular hemorrhages (asterisks) and heart failure (arrowhead) in bar. (B) Tg(kdrl:GFP)s843bar show vascular integrity defects (arrows) and collapsed endocardium (arrowhead). Scale bar, 300 µm.(C) Tg(Fli1a:GFP)y1bar show severe loss of cranial network vasculature and fragmented endothelium (arrow) at 65 hpf.(D) Confocal images of trunk vasculature of Tg(kdrl:GFP)s843bar report loss of ECs at the level of Se, DA (arrows), and PCV. Scale bar, 50 µm.(E) NADP+/NADPH ratio at 60 hpf. Increased ratio is indicative of oxidative stress state.(F) Real-time PCR analysis show upregulation of the antioxidant genes glutathione peroxidase1a (gpx1a) and heme-oxigenase1 (hmox1) in bar at 56 hpf. Data are means ± SD.(G) Quantification of oxidative stress level in ECs derived from Tg(kdrl:GFP)s843 embryos at 56 hpf.(H) Immunofluorescence analyses for S-nitroso-cysteine (SNO-Cys, red) and DNA (blue) in Tg(kdrl:GFP)s843bar and sib embryos at 60 hpf. Upper left: heart transverse sections; upper right: quantification of SNO-Cys positive cells. Lower left: trunk vasculature transverse sections; lower right: quantification of SNO-Cys positive cells. Scale bar, 75 µm. Specific SNO-Cys signals were also detectable in pronephros and myocardium of bar (arrowhead).(I) Immunofluorescence analyses for 8-hydroxy-22deoxyguanosine (8OHdG, red) and DNA (blue) in Tg(kdrl:GFP)s843bar and sib at 56 hpf. Upper left: heart transverse sections; upper right: quantification of 8OHdG positive cells. Scale bars, 50 µm. Lower left: trunk vasculature transverse sections; lower right; quantification of 8OHdG positive. Scale bar, 20 µm. bar show specific 8OHdG staining in endocardial and endothelial cells (arrows) and myocardium (arrowhead).(L) TUNEL-positive (red) cells show apoptosis in endocardium and endothelium (arrows). Upper left: heart transverse sections of Tg(kdrl:GFP)s843bars847 and sib; upper right: quantification of TUNEL-positive cells. Lower left: transverse sections of trunk vasculature; lower right: quantification of positive cells in DA and PCV. Scale bars, 20 µm.(M) Genetic map of the zebrafish barolo locus. The SSLP markers (z22307) was used to identify the “zero recombinant” region by analysis of 987 diploid mutants.(N) Schematic representation of zebrafish Ubiad1. UbiA:UbiA domain.(O) Western blot analysis of protein extracts from bars847 and bart31131 and respective siblings at 72 hpf.(P) Embryos from bars847 and bart31131 heterozygote intercrosses were injected with mRNA encoding for wild-type ubiad1 mRNA, ubiad1L62Q or fluorescent protein cherry (ctrl). bars847 as well as bart31131 were not rescued by microinjection of ubiad1L62Q mRNA.A, atrium; V, ventricle; DA, dorsal aorta; PCV, posterior cardinal vein; BuA bulbus arteriosus; PD, pronephric ducts; E, endocardium; M myocardium. All data are means ± SEM. p < 0.01, p < 0.001.See also S1, Table S1, and Movies S1, S2, S3, and S4. |

Block of Mevalonate Pathway Causes Cardiovascular Failure in Zebrafish Embryos by Reducing CoQ10 Synthesis(A) Wild-type (WT) embryos at 72 hpf treated from 54 hpf with statin (mevastatin) or DMSO. Statin treatments induce a bar-like phenotype which is characterized by hemorrhages (asterisk) and heart failure (arrowhead). Scale bar, 300 µm.(B) Three dimensional projections of trunk vessels at 72 hpf of DMSO and statin-treated zebrafish embryos. Statin treatments induce specific endothelial vessels regression and fragmentation in DA and Se (arrows). Scale bar, 100 µm.(C) Quantification of bar-like phenotype after statin treatments. MEV, mevastatin 500 nM; SIM, simvastatin 500 nM; MEN, mevinolin 500 nM.(D) and cholesterol (E) detected by HPLC-UV analyses in statin-treated embryos.(F and G) Bright-field (F) and fluorescent (G) images of Tg(kdrl:GFP)s843ubiad1+/+ and ubiad1+/- embryos at 65 hpf treated with mevastatin (2.5 nM and 5 nM) from 32 to 50 hpf. Treatment with a low dose of statin caused hemorrhages (asterisks) and altered heart morphology (arrowheads) in ubiad1+/-, but not in ubiad1+/+ embryos. Although treatment with a low dose of statin did not induce specific alterations of the main vasculature, ubiad1+/- embryos showed head vasculature, Se, and DA regression; scale bar, 300 µm.(H) Images of Tg(kdrl:GFP)s843ubiad1+/+ and ubiad1+/- embryos trunk vasculature show thinner and collapsed Se and DA morphology in statin-treated ubiad1+/- but not in ubiad1+/+ embryos. Scale bar, 75 µm.(I) Penetrance of bar-like phenotype at 65 hpf after treatment with mevastatin. ubiad1+/- embryos are significantly more sensitive to develop a bar-like phenotype than normal embryos (ubiad1+/+).(J) CoQ10 supplemented embryos show less susceptibility to statin treatments in terms of developing a bar-like phenotype as indicated by histograms showing the percentage of statin-treated embryos having bar-like phenotype after exogenous CoQ10 delivery.(K) CoQ10 supplementation before statin treatment prevents cardiac edema (arrowhead) and brain hemorrhages (asterisk) in barolo. Images of vehicle- and CoQ10-injected embryos after statin treatment. Scale bar, 300 µm.(L) Histograms show oxidative stress in embryos after statin treatment with or without CoQ10.All data are means ± SEM. p < 0.001.See also Figure S3. PHENOTYPE:
|
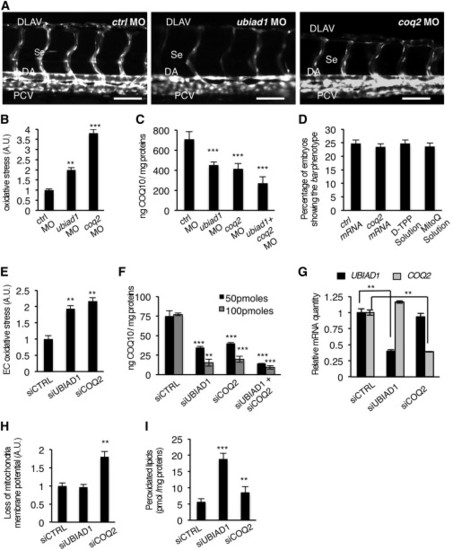
Ubiad1 and Coq2 Play Different Functions during Development(A) Se integrity is affected in Tg(kdrl:GFP)s843 embryos injected with ubiad1 morpholino (ubiad1 MO) but not in coq2 morphants (coq2 MO). Scale bar, 100 µm.(B) Oxidative stress levels in entire ubiad1 morphants (ubiad1 MO), coq2 morphants (coq2 MO), and relative control (ctrl MO).(C) CoQ10 levels detected by HPLC-MS are significantly lower in ubiad1 morphants (ubiad1 MO), coq2 morphants (coq2 MO), ubiad1 and coq2 double morphants (ubiad1+ coq2 MO) than control morphants (ctrl MO).(D) Embryos from bar heterozygote intercrosses were injected with coq2 mRNA and mitochondria-targeted CoQ10 analog called MitoQ (10 µM) or cherry mRNA and Decyl-TPP (10 µM) as respective controls. Phenotypes were scored at 72 hpf. bar phenotype is not caused by lack of mitochondria CoQ10.(E) Silencing of both CoQ10 biosynthetic enzymes (siUBIAD1 and siCOQ2) cause increase of total cellular ROS in ECs.(F) Levels of CoQ10 detected by HPLC-MS in total lipid extracts from HUAEC silenced for UBIAD1 (siUBIAD1), COQ2 (siCOQ2), or both (siUBIAD1+siCOQ2). UBIAD1 and COQ2 were silenced with 50 pmoles (black bars) or with 100 pmoles (gray bars). Levels of CoQ10 are significantly reduced in cells silenced for UBIAD1 or COQ2 expression.(G) Quantitative PCR analyses of UBIAD1 and COQ2 mRNA levels in HUAEC cells.(H) Quantification of loss of mitochondrial membrane potential (Δψm) in HUAEC silenced for UBIAD1 (siUBIAD1) or COQ2 (siCOQ2).(I) Quantification of lipid peroxidation by MDA adducts levels in HUAEC silenced for UBIAD1 (siUBIAD1) or COQ2(siCOQ2).All data are means ± SD. p < 0.01, p < 0.001.See also Figure S5. PHENOTYPE:
|
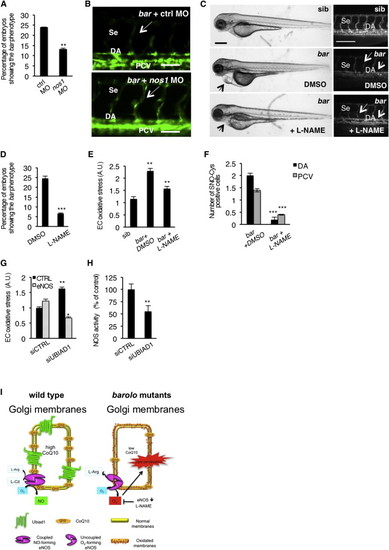
NOS Activity in Cardiovascular Tissues Is Regulated by UBIAD1 and CoQ10(A) Knockdown of endothelial nitric oxide synthase 1 by morpholino (nos1 MO) reduces the penetrance of bar phenotype at 72 hpf.(B) Knockdown of nos1 rescue endothelial integrity defects of bar mutants. Images of Se of bar at 72 hpf injected with nos1 morpholino (bar + nos1MO) or control morpholino (bar + ctrl MO) Scale bar, 50 µm.(C) Bright-field images (left) and fluorescent micrographs showing the trunk vasculature (right) of Tg(kdrl:GFP)s843bar treated from 48 hpf with the specific eNOS inhibitor L-NAME (500 µM). Heart failure (arrowhead) and endothelial regression (arrows) were fully rescued by L-NAME treatment. Scale bar, 100 µm.(D) Penetrance of the bar phenotype at 65 hpf is significantly decreased by inhibition of eNOS activity with L-NAME treatment from 32 hpf.(E) Oxidative stress level in ECs derived from Tg(kdrl:GFP)s843bar mutant embryos is decreased by L-NAME treatment.(F) eNOS inhibition by L-NAME treatment significantly reduces ECs positive for S-nitroso-cysteine (SNO-Cys) in DA and PCV of bar embryos.(G) Silencing of eNOS (sieNOS) rescues oxidative stress induced by the lack of UBIAD1 (siUBIAD1). Silencing eNOS alone did not decrease ROS level in ECs.(H) Silencing of UBIAD1 gene (siUBIAD1) causes a significant decrease of eNOS activity in ECs evaluated as [3H]-L-citrulline.(I) Schematic representation of Ubiad1 molecular function in CoQ10 production and maintenance of nitrix oxide (NO) signaling. In wild-type cells, Ubiad1 localizes in the Golgi compartment and produces CoenzymeQ10 (CoQ10), an antioxidant molecule, important to counteract oxidative damage in particular in cellular membranes (cytosol and plasma membrane). In the Golgi compartment CoQ10 as an electron carrier might also play a fundamental role as a cofactor for eNOS activity by maintaining its “coupled” conformation and allowing normal NO production. On the other hand, lack of UBIAD1 and lowering of CoQ10, as occurs in the cardiovascular tissues of bar mutants, might “uncouple” eNOS causing loss of NO production and consequently reactive oxygen species overload leading to cellular oxidative damage (e.g., lipid peroxidation). Thereby, the “barolo” phenotypes can be rescued by impairment of eNOS activity or expression. Data are means ± SEM. p < 0.05, p < 0.01, p < 0.001. See also Figure S6. PHENOTYPE:
|
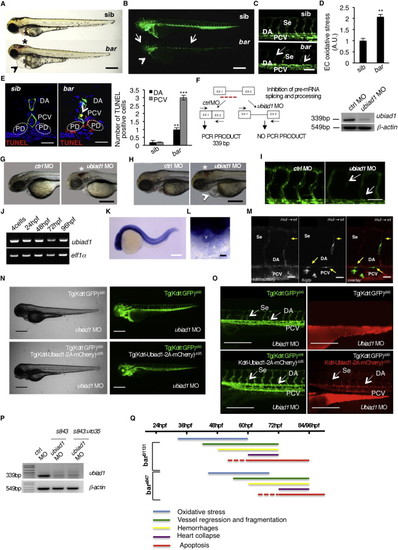
Barolo Alleles Phenotypes Are Characterized by Oxidative Stress Leading to Progressive Cardiovascular Failure, Related to Figure 1(A) Wild-type siblings s847 (sib) and barolos847 (bar) mutant embryos at 72 hpf. Vascular hemorrhages (asterisk) and heart failure (arrowhead) are visible in bars847 mutants. Scale bar, 300 �m.(B) Fluorescent micrographs of Tg(kdrl:GFP)s843 siblings (sib) and barolos847 (bar) mutants at 72 hpf. bars847 mutants show vascular integrity defects and regression both in brain and trunk vasculature (arrows). Endothelial cell regression is observed throughout the vascular network of bars847 mutants at 72 hpf. The collapsed endocardium is also evident (arrowhead). Scale bar, 300 �m.(C) Fluorescent micrographs representing magnification of trunk vasculature of Tg(kdrl:GFP)s843 sib s847 (sib) and barolos847 (bar) mutants at 72 hpf. In bars847 mutant�s endothelial cells are lost at the level of intersegmental vessels (Se), dorsal aorta (DA) and posterior cardinal vein (PCV) (arrows). Scale bar, 50 �m.(D) Histogram shows relative quantifications of oxidative stress in primary endothelial cells derived from Tg(kdrl:GFP)s843 sib s847 (sib) and bars847 (bar) mutant at 65 hpf. ROS levels in endothelial cells of zebrafish embryos were measured by flow cytometric analyses using the specific CellROX probe on Kdrl:GFP+ cells. ROS level is significantly higher in bars847 mutants than respective siblings. Results are shown as a mean of n = 3 independent experiments. Data are means � SD.(E) Staining of Tg(kdrl:GFP)s843 sibs847 (sib) and barolos847 (bar) mutant embryos at 80 hpf for TUNEL (red) and DNA (blue). Left: confocal transverse sections of trunk vasculature at the level of the 10th somite; right: histograms report numbers of dorsal aorta and posterior cardinal vein cells positive for TUNEL staining. Data are means � SD; p < 0.01, p < 0.001. TUNEL-positive cells were also present in pronephric ducts of bar mutants. Scale bars, 100 �m.(F) Validation of in vivo ubiad1 knockdown by morpholino injection. Left: schematic diagram shows the molecular mechanism of ubiad1splice-morpholino (ubiad1 MO; dashed line). ubiad1 MO targeting the splicing site between exon1 (EX1) and intron1 blocks ubiad1 pre-mRNA maturation and leads to ubiad1 non-coding mRNA. Molecular mechanism of control non-targeting morpholino (ctrl MO) is also indicated. Primers used for RT-PCR validation are localized on exons 1 and 2 (EX1-EX2; black arrows). Right: RT-PCR analysis was performed on cDNA from zebrafish embryos 72 hr post microinjection. Amplification of 339 bp is possible only for cDNA from ctrl-injected embryos, whereas no amplification is expected from ubiad1MO-injected embryos. Compared to ctrl MO, ubiad1 MO show reduced 339 bp PCR products.Representative bright-field images of ubiad1 morphants (ubiad1 MO) and relative control (ctrl MO) at 48 hpf (G) and 72 hpf (H). ubiad1 morphants such as bar mutants are characterized by brain hemorrhages (asterisk) and stringy heart morphology (arrowhead). Scale bar, 100 �m.(I) Fluorescent micrographs of trunk vasculature (between 14th and 18th somites) of Tg (kdrl:GFP)s843ubiad1 morphants (ubiad1 MO) and control (ctrl MO) injected embryos at 72 hpf. Knockdown of ubiad1 led to loss of intersegmental vessels integrity (arrows) as observed in bar mutants. Scale bar, 75 �m.(J) RT-PCR analyses for ubiad1 mRNA expression and ef1� (as control) on cDNA from wild-type embryos at different developmental stages. Samples are from 4-cell stage to 96 hpf stage.(K) Whole-mount ISH analyses of wild-type embryo at 24 hpf show ubiad1 mRNA expression throughout the embryo. Scale bar, 250 �m.(L) Magnification on heart of whole-mount ISH analyses of wild-type embryo at 48 hpf. Specific expression of ubiad1 mRNA can be detected in the developing heart. A, atrium; V, ventricle. Scale bar, 50 �m.(M) Cell transplantation experiments in barolo mutant embryos. Confocal fluorescent image shows chimeric vessels made of endothelial cells from Tg(fli:GFP)y1bart31131 mutant embryos (donor) that have been transplanted at pre-dome stage into Tg(kdrl: mCherry)uto2 wild-type (wt) embryos (acceptor) and visualized at 48 hpf. Transplanted mutant endothelial cells (green fluorescence) show retracting and collapsed morphology (arrows), also at the level of intersegmental vessel (Se) and dorsal aorta (DA) suggesting ubiad1 acts cell autonomously. Left: mCherry channel corresponding to Tg(kdrl: mCherry)uto2 wild-type cells. Middle: GFP channel corresponding to Tg(fli:GFP)y1bart31131 mutant endothelial cells. Right: Merge image of mCherry and GFP channels. Se, intersomitic vessels; DA, dorsal aorta; PCV, posterior cardinal vein. Scale bar, 20 �m.(N) Bright field (left) and corresponding fluorescent micrographs (right) of Tg(kdrl:GFP)s843 and Tg [(kdrl-Ubiad1-2A-mCherry)uto35; (kdrl:GFP)s843 ] wild-type embryos injected with ubiad1 splice-morpholino (ubiad1 MO). After morpholino injection Tg(kdrl:GFP)s843 embryos show characteristic barolo phenotype (upper). On the contrary, after ubiad1 morpholino injection Tg [(kdrl-Ubiad1-2A-mCherry)uto35; (kdrl:GFP)s843 ] show wild-type phenotype (lower). Scale bar, 400 �m.(O) Magnification of trunk vasculature of embryos showed in (N). Green fluorescence shows endothelial cells. Red fluorescence, which is exclusive of uto35 line, indicates expression of exogenous Ubiad1 in endothelial cells (lower right). Injection of ubiad1 morpholino in Tg(kdrl:GFP)s843 induce bar phenotype characterized by intersegmental vessels (Se) disintegration and collapsed dorsal aorta (DA) (upper left; arrows). Injection of ubiad1 morpholino in Tg [(kdrl-Ubiad1-2A-mCherry)uto35;(kdrl:GFP)s843 ] do not exert any vascular phenotype (lower left; arrowheads) indicating that endothelial-specific expression of Ubiad1 is sufficient to prevent barolo cardiovascular phenotype. All together these data support that Ubiad1 acts cell autonomously in vascular cells. Scale bar, 150 �m.(P) Validation of ubiad1 knockdown by morpholino injection, related to embryos in (N and O). RT-PCR analysis was performed on cDNA from zebrafish embryos at 72 hpf. Amplification of 339bp is possible only for cDNA from ctrl MO-injected embryos (ctrl MO), whereas no amplification is expected from ubiad1MO-injected embryos (ubiad1 MO). Compared to ctrl MO, ubiad1 MO show reduced 339bp PCR products in Tg(kdrl:GFP)s843 (s843) as well as in Tg [(kdrl-Ubiad1-2A-mCherry)uto35; (kdrl:GFP)s843 ] (s843:uto35) morphants. RT-PCR strategy is showed in (F).(Q) Chronological documentation of barolo phenotypes onset. bart31131 mutant embryos phenotype starts with an increase of oxidative stress (detectable from 32 hpf until 60 hpf) that causes a progressive cardiovascular breakdown characterized by vessels regression and fragmentation (starting from 40 hpf), hemorrhages (from 48 hpf) and heart failure (from 60 hpf). barolo cardiovascular degeneration ends up with heart and vascular cells apoptosis that become evident at molecular levels starting from 60 hpf. Definitive signs of apoptosis can be scored at 72 hpf.bars847 shows the same progressive cardiovascular failure features of as bart3113, but delayed of 12 hr in the same experimental conditions. Both barolo alleles are not able to survive over 96 hpf. PHENOTYPE:
|
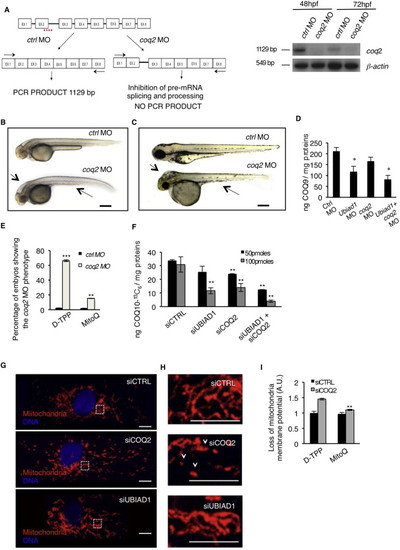
UBIAD1 Functions Differently from Mitochondrial COQ2, Related to Figure 6 (A) Validation of in vivo coq2 knockdown by morpholino injection. Left: schematic diagram shows the molecular mechanism of coq2 splice- morpholino (coq2 MO; dashed line). coq2 MO targeting the splicing site between exon2 (EX2) and intron2 (IN2) blocks coq2 pre-mRNA maturation and leads to coq2 non-coding mRNA. Molecular mechanism of control non-targeting morpholino (ctrl MO) is also indicated. Primers used for RT-PCR validation are localized on exons 1 and exon 8 (EX1, EX8; black arrows). RT-PCR analysis was performed on cDNA from zebrafish embryos at 48h and 72 hr post microinjection. Amplification of 1129bp is possible only for cDNA from ctrl MO-injected embryos, whereas no amplification is expected from coq2 MO-injected embryos. Compared to control morphants, coq2 MO show reduced PCR products. Representative bright field pictures of coq2 morphants (coq2 MO) and controls (ctrl MO) at 48 hpf (B) and 72 hpf (C). At 48 hpf coq2 MO show hindbrain edema (arrow), and abnormal yolk sac morphology. Scale bar, 500 �m. At 72 hpf coq2 morphants show severe brain edema (arrow) and severe development delayed. These are typical features of reduced energy metabolism possibly due to primary CoQ10 deficiency. Scale bar, 300 �m.(D) Histograms show levels of endogenous CoQ9 detected by HPLC-MS analyses in ubiad1 morphants (ubiad1 MO), coq2 morphants (coq2 MO), double morphants (ubiad1+ coq2 MO). Compared to control (ctrl MO), the CoQ9 levels are significantly lower in ubiad1 morphants. coq2 morphants show a reduced decreased in CoQ9 levels compared to ubiad morphants. Such difference is under investigation. Results are shown as a mean of n = 3 independent experiments for each condition.(E) Mitochondria-targeted CoQ10 (MitoQ) efficiently rescue coq2 morphants. Histogram shows the percentage of embryos showing the coq2 morpholino phenotype when injected with mitochondria-targeted CoQ10 (MitoQ; 10 �M) or its respective control (D-TPP). Supplementation of MitoQ but not of D-TPP clearly rescues the absence of coq2 in zebrafish embryos. Results are shown as a mean of n = 3 independent experiments for each condition.(F) Histograms show levels of 13C6-labeled CoQ10 (CoQ10-13C6) detected by HPLC-MS in total lipid extracts from human primary endothelial cells (HUAEC) silenced for UBIAD1 (siUBIAD1), COQ2 (siCOQ2) or both (siUBIAD1+siCOQ2). UBIAD1 and COQ2 were silenced with 50 pmoles (black bars) or with 100 pmoles (gray bars) of respective siRNA. Compared to relative control (siCTRL), the levels of CoQ10-13C6 are significantly reduced in cells silenced for UBIAD1 or COQ2 expression. The combination of the two siRNA further decrease CoQ10 levels. Results are shown as a mean of n = 3 independent experiments for each condition.(G) Confocal images of human primary endothelial cells (HUAEC) transfected with siRNA for UBIAD1 (siUBIAD1), COQ2 (siCOQ2) or control (siCTRL) and stained for mitochondria (red) and DNA (blue). Regular reticular mitochondrial morphology is detected in cells treated with siUBIAD1 and siCTRL. On the contrary, cells treated with siCOQ2 show less and fragmented mitochondria. Scale bar, 10 �m.(H) Magnification of the area outlined in (G). siCOQ2-treated cells show few and collapsed mitochondria (arrowhead). In contrast normal reticular mitochondria morphology is evident in siUBIAD1- and siCTRL-treated cells. Scale bar, 0.5 �m.(I) Histograms show the loss of mitochondria membrane potential (��m) of human EC silenced for COQ2 after treatment with the mitochondria-targeted CoQ10 (MitoQ) efficiently rescue coq2 morphants. MitoQ (10nM) but not D-TPP (10nM) supplementation efficiently rescues loss of mitochondrial membrane potential of siCOQ2 ECs. These results indicate that mitochondrial damage in siCOQ2 cells is due to loss of mitochondrial CoQ10. Results are shown as a mean of n = 3 independent experiments for each condition. All data are means � SD, p < 0.05, p < 0.01, p < 0.001. PHENOTYPE:
|
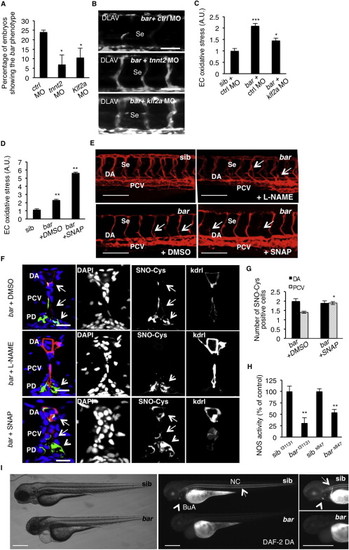
UBIAD1 Regulates a Blood Flow-Dependent NO Signaling and NO-dependent Oxidative Stress, Related to Figure 7 (A) Embryos from bart31131 heterozygote intercrosses were injected at one-cell stage with tnnt2 morpholino (tnnt2 MO) or Kruppel-like factor 2a morpholino (klf2a MO) or control morpholino (ctrl MO). Histogram shows the percentage of larvae showing the bar mutant phenotype at 72 hpf after injection. Compared to control, impairment of the blood flow-Klf2a pathway by morpholino injection significantly delayed the penetrance of the bar phenotype, evaluated as trunk vessels disintegration. Results are shown as a mean of n = 2 independent experiments for each condition.(B) Fluorescent micrographs of DLAV and Se of Tg(kdrl:GFP)s843bar mutants at 72 hpf after injection of control morpholino (ctrl MO), tnnt2 morpholino (tnnt2 MO), klf2a morpholino (klf2a MO). Knockdown of tnnt2 and klf2a delayed Se and DLAV disintegration in bar mutants. Se, intersegmental vessels; DLAV: dorsal longitudinal anastomotic vessel. Scale bar, 75 �m.(C) Histograms show oxidative stress levels in endothelial cells (EC) derived from Tg(kdrl:GFP)s843bart31131 after klf2a morpholino injection. barolo mutants were injected with control morpholino (ctrl MO) or klf2a morpholino (klf2a MO). Compared to control-injected embryos, klf2a MO-injected barolo (bar) mutants show reduced EC oxidative stress levels. Results are shown as a mean of n = 2 independent experiments for each condition.(D) Histograms show oxidative stress levels in endothelial cells derived from Tg(kdrl:GFP)s843 and bart31131 (bar) mutant at 65 hpf after treatment with the NO donor, S-nitroso-N-acetyl-DL-penicillamine (SNAP) or DMSO as control. ROS levels in endothelial cells of zebrafish embryos were measured by flow cytometric analyses using the specific CellROX probe on Kdrl:GFP+ cells. NO overload in barolo cardiovascular tissues significantly enhances oxidative stress level. Results are shown as a mean of n = 2 independent experiments for each condition.(E) Representative confocal 3D projections of trunk vasculature between 10th and 18th somites of Tg(Kdrl:mCherry)uto2barolos847(bar) mutant at 65 hpf. Embryos were treated from 48 hpf with the NO inhibitor, N- Nitro-L-arginine methyl ester hydrochloride (L-NAME; 500 �M) or NO donor, S-nitroso-N-acetyl-DL-penicillamine (SNAP; 100 �M) or equivalent volume of DMSO as control.Compared to DMSO-treated embryos, L-NAME treatment efficiently prevents cardiovascular failure as indicated by intact dorsal aorta (DA), posterior cardinal vein (PCV) and intersegmental vessels integrity (Se) (arrows). On the other hand, SNAP treatment accelerates oxidative stress and cardiovascular failure in bar mutant embryos. Scale bar, 150 �M.(F) Confocal transverse sections of Tg(kdrl:GFP)s843bart31131 trunk vasculature at the level of 10th somite and stained for S-nitroso-cysteine, a biomarker of oxidative damage at 65 hpf. Confocal acquisitions are showed as single channel images and relative merged image: DNA (DAPI, blue), S-nitroso-cysteine (SNO-Cys, red), endothelium (Kdrl; green). bart31131 were previously treated with the NO inhibitor, L-NAME (500 �M) or NO donor, SNAP (100 �M) or DMSO as relative control. Oxidative stress-positive cells are detectable in dorsal aorta (DA) and posterior cardinal vein (PCV) in bart31131 (arrows) and SNAP-treated bar embryos. L-NAME treatment blocks oxidative stress in cardiovascular cells but not in pronephros suggesting a eNOS-dependent mechanism in oxidative stress caused by the loss of Ubiad1. DA, dorsal aorta; PCV posterior cardinal vein. Scale bar, 20 �m.(G) Histograms show numbers of endothelial cells in dorsal aorta (DA) and posterior caudal vein (PCV) positive for S-nitroso-cysteine (SNO-Cys) in bar mutant embryos treated with DMSO or the NO donor, SNAP (100 �M). Comparative confocal 3D projections were analyzed for SNO-Cys-positive endothelial cells in dorsal aorta and posterior cardinal vein. Results are shown as a mean of n = 3 independent experiments for each condition.(H) Histograms show NOS activity in protein extracts from barolo mutants (bar) and siblings (sib) at 72 hpf. Evaluation of NOS activity was based on conversion of [3H]-L-arginine to [3H]-L-citrulline. bart31131 and bars843 mutants show significant reduction in NOS activity compared to controls. These results indicate that loss of Ubiad1 impairs NOS enzymatic activity and therefore NO production. Results are shown as a mean of n = 2 independent experiments for each condition.(I) Representative micrographs of bar mutant embryos (bar) and siblings (sib) stained for nitric oxide (NO) with the green fluorescent probe 4,5 Diaminofluorescein Diacetate (DAF-2DA) at 72 hpf. NO production in the notochord (NC; arrows) and bulbus arteriousus (BuA; arrowheads) are evident in sibling but not in bar mutants. Scale bar, 300 �m. BuA, bulbus arteriosus; NC, notochord.All data are means � SEM; p < 0.05, p < 0.01, p < 0.001. PHENOTYPE:
|
Reprinted from Cell, 152(3), Mugoni, V., Postel, R., Catanzaro, V., De Luca, E., Turco, E., Digilio, G., Silengo, L., Murphy, M.P., Medana, C., Stainier, D.Y., Bakkers, J., and Santoro, M.M., Ubiad1 Is an Antioxidant Enzyme that Regulates eNOS Activity by CoQ10 Synthesis, 504-518, Copyright (2013) with permission from Elsevier. Full text @ Cell