
Fig. S5
- ID
- ZDB-FIG-130326-21
- Publication
- Mugoni et al., 2013 - Ubiad1 Is an Antioxidant Enzyme that Regulates eNOS Activity by CoQ10 Synthesis
- Other Figures
- All Figure Page
- Back to All Figure Page
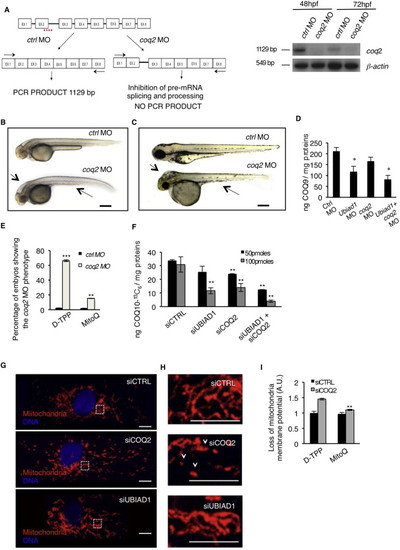
UBIAD1 Functions Differently from Mitochondrial COQ2, Related to Figure 6 (A) Validation of in vivo coq2 knockdown by morpholino injection. Left: schematic diagram shows the molecular mechanism of coq2 splice- morpholino (coq2 MO; dashed line). coq2 MO targeting the splicing site between exon2 (EX2) and intron2 (IN2) blocks coq2 pre-mRNA maturation and leads to coq2 non-coding mRNA. Molecular mechanism of control non-targeting morpholino (ctrl MO) is also indicated. Primers used for RT-PCR validation are localized on exons 1 and exon 8 (EX1, EX8; black arrows). RT-PCR analysis was performed on cDNA from zebrafish embryos at 48h and 72 hr post microinjection. Amplification of 1129bp is possible only for cDNA from ctrl MO-injected embryos, whereas no amplification is expected from coq2 MO-injected embryos. Compared to control morphants, coq2 MO show reduced PCR products. Representative bright field pictures of coq2 morphants (coq2 MO) and controls (ctrl MO) at 48 hpf (B) and 72 hpf (C). At 48 hpf coq2 MO show hindbrain edema (arrow), and abnormal yolk sac morphology. Scale bar, 500 �m. At 72 hpf coq2 morphants show severe brain edema (arrow) and severe development delayed. These are typical features of reduced energy metabolism possibly due to primary CoQ10 deficiency. Scale bar, 300 �m.(D) Histograms show levels of endogenous CoQ9 detected by HPLC-MS analyses in ubiad1 morphants (ubiad1 MO), coq2 morphants (coq2 MO), double morphants (ubiad1+ coq2 MO). Compared to control (ctrl MO), the CoQ9 levels are significantly lower in ubiad1 morphants. coq2 morphants show a reduced decreased in CoQ9 levels compared to ubiad morphants. Such difference is under investigation. Results are shown as a mean of n = 3 independent experiments for each condition.(E) Mitochondria-targeted CoQ10 (MitoQ) efficiently rescue coq2 morphants. Histogram shows the percentage of embryos showing the coq2 morpholino phenotype when injected with mitochondria-targeted CoQ10 (MitoQ; 10 �M) or its respective control (D-TPP). Supplementation of MitoQ but not of D-TPP clearly rescues the absence of coq2 in zebrafish embryos. Results are shown as a mean of n = 3 independent experiments for each condition.(F) Histograms show levels of 13C6-labeled CoQ10 (CoQ10-13C6) detected by HPLC-MS in total lipid extracts from human primary endothelial cells (HUAEC) silenced for UBIAD1 (siUBIAD1), COQ2 (siCOQ2) or both (siUBIAD1+siCOQ2). UBIAD1 and COQ2 were silenced with 50 pmoles (black bars) or with 100 pmoles (gray bars) of respective siRNA. Compared to relative control (siCTRL), the levels of CoQ10-13C6 are significantly reduced in cells silenced for UBIAD1 or COQ2 expression. The combination of the two siRNA further decrease CoQ10 levels. Results are shown as a mean of n = 3 independent experiments for each condition.(G) Confocal images of human primary endothelial cells (HUAEC) transfected with siRNA for UBIAD1 (siUBIAD1), COQ2 (siCOQ2) or control (siCTRL) and stained for mitochondria (red) and DNA (blue). Regular reticular mitochondrial morphology is detected in cells treated with siUBIAD1 and siCTRL. On the contrary, cells treated with siCOQ2 show less and fragmented mitochondria. Scale bar, 10 �m.(H) Magnification of the area outlined in (G). siCOQ2-treated cells show few and collapsed mitochondria (arrowhead). In contrast normal reticular mitochondria morphology is evident in siUBIAD1- and siCTRL-treated cells. Scale bar, 0.5 �m.(I) Histograms show the loss of mitochondria membrane potential (��m) of human EC silenced for COQ2 after treatment with the mitochondria-targeted CoQ10 (MitoQ) efficiently rescue coq2 morphants. MitoQ (10nM) but not D-TPP (10nM) supplementation efficiently rescues loss of mitochondrial membrane potential of siCOQ2 ECs. These results indicate that mitochondrial damage in siCOQ2 cells is due to loss of mitochondrial CoQ10. Results are shown as a mean of n = 3 independent experiments for each condition. All data are means � SD, p < 0.05, p < 0.01, p < 0.001. |
| Fish: | |
|---|---|
| Knockdown Reagent: | |
| Observed In: | |
| Stage Range: | Long-pec to Protruding-mouth |
Reprinted from Cell, 152(3), Mugoni, V., Postel, R., Catanzaro, V., De Luca, E., Turco, E., Digilio, G., Silengo, L., Murphy, M.P., Medana, C., Stainier, D.Y., Bakkers, J., and Santoro, M.M., Ubiad1 Is an Antioxidant Enzyme that Regulates eNOS Activity by CoQ10 Synthesis, 504-518, Copyright (2013) with permission from Elsevier. Full text @ Cell