
- Title
-
Tbx1 is required for second heart field proliferation in zebrafish
- Authors
- Nevis, K., Obregon, P., Walsh, C., Guner-Ataman, B., Burns, C.G., and Burns, C.E.
- Source
- Full text @ Dev. Dyn.
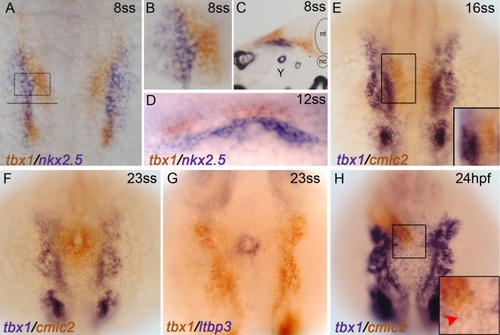
tbx1 transcripts do not co-localize with CPCs or cardiomyocytes during early cardiogenesis in zebrafish. Whole-mount double in situ hybridizations are shown. A–D: tbx1 (red) and nkx2.5 (blue) transcripts are non-overlapping at 8ss and 12ss. A: Flat mount, dorsal view, anterior up, 10× maginification. B: 20× magnification of the ALPM (boxed region in A). C: Transverse cryo-section, through the left ALPM (location of section shown by the solid line in A), 20× magnification, nt = neural tube, nc = notochord, Y = yolk. D: Dorso-lateral view showing that tbx1-expressing cells reside dorsal to nkx2.5-expressing CPCs at 12ss. E,F: tbx1+ cells are lateral to cmlc2+ cardiomyocytes at 16ss and 23ss. Dorsal view, anterior up, 10× magnification. Inset is 20× magnification of the boxed region photographed from a more dorsolateral view. G: tbx1+ cells are lateral to ltbp3+ SHF progenitors at 20.5hpf/23ss. Dorsal view, anterior up, 10× magnification. H: At 24hpf, the linear heart tube resides dorsal to the tbx1 expression domain in different planes of focus. Dorsal view, anterior up, 10× magnification. tbx1 is not expressed at the arterial pole of the linear heart tube where SHF progenitors reside (red arrowhead). Inset is 20× magnification of boxed region. EXPRESSION / LABELING:
|
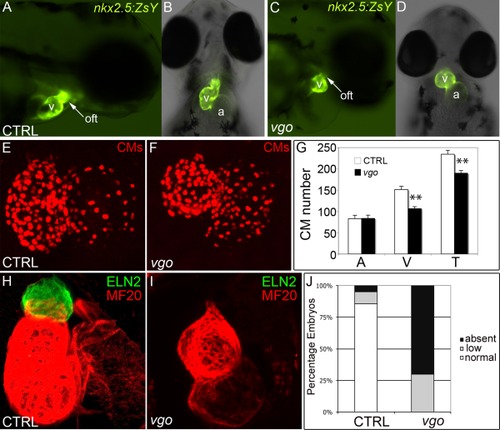
tbx1 mutants display diminutive ventricles caused by decreased cardiomyocyte numbers and diminished OFT smooth muscle. A–D: Fluorescence microscopy images of Tg(nkx2.5:ZsYellow) control (CTRL) and vgo embryos; 10× magnification. At 72 hpf, the ventricular chamber and OFT appears small in vgo (C,D) compared to control (A,B). A,C: Lateral view, anterior right. B,D: Ventral view, anterior up. v = ventricle, a = atrium, oft = outflow tract. E,F: Flattened confocal images of cardiomyocyte (CM) nuclei in 72hpf Tg(cmlc2::DsRednuc) control (E) and vgo (F) hearts. G: Graph depicting the average number of CMs at 72hpf in control (n=4) and vgo (n=4) embryos. Asterisks indicate statistical significance as determined using unpaired Student′s t-test. Error bars represent +/ 1s.e.m. Atrial (A) CM numbers remain unchanged (P=0.47), while ventricular (V) and total (T) CM numbers are significantly lower in vgo mutants (P=0.00008 and 0.0002, respectively). H,I: Flattened confocal images following double immunofluorescence to visualize OFT smooth muscle precursors (Eln2; green) and chamber cardiomyocytes (MF20; red) in 72 hpf control (n=21; H) and vgo (n=20; I) embryos. J: Graph depicting the percentages of control or vgo embryos with normal low, or absent Eln2 staining. EXPRESSION / LABELING:
PHENOTYPE:
|
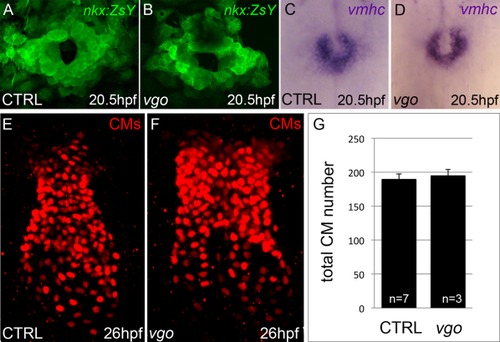
FIrst heart field development is unaffected in tbx1 mutants. A,B: Flattened confocal images of Tg(nkx2.5::ZsYellow) control (n=37; A) and vgo (n=14; B) embryos at 20.5hpf/23ss. C,D: Whole-mount in situ hybridization of vmhc at 20.5hpf/23ss in both control (n=16; C) and vgo (n=16; D) embryos. E,F: Flattened confocal images following immunofluorescence of cardiomyocyte nuclei comprising the linear heart tubes of 26 hpf control (E) and vgo (F) Tg(cmlc2:dsRed2-nuc) embryos. Dorsal view, anterior up in all images. G: Graph depicting the average number of CMs at 26 hpf in control and vgo embryos. EXPRESSION / LABELING:
|
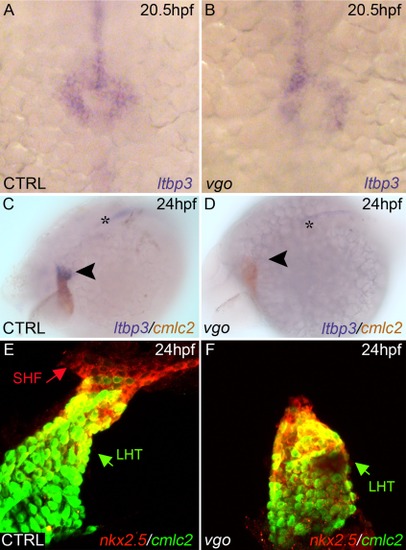
Initial specification of SHF progenitors is not perturbed in vgo embryos. A,B: ltbp3 was observed via whole-mount in situ hybridization at 20.5hpf/23ss in control (A) and vgo (B) embryos (n>12). Dorsal view, anterior down. 20× magnification. C,D: Whole-mount double in situ hybridization at 26 hpf shows ltbp3+ (blue) cells at the arterial pole (arrowhead) of the cmlc2+ (red) heart tube in control embryos. ltbp3 expression is drastically reduced (21%) or absent (79%) at the arterial pole of vgo hearts (n=14). Asterisk indicates ltbp3 expression within the notochord. E,F: At 26hpf, double transgenic Tg(nkx2.5::ZsYellow); Tg(cmlc2::GFP) control (E) and vgo (F) embryos were co-immunostained with GFP antibody (anti-GFP, green) and ZsYellow antibody (anti-RCFP, red). The future atrial segment of the linear heart tube (LHT, green arrow) expresses cmlc2 alone (green), while the future proximal ventricular myocardium co-expresses cmlc2 and nkx2.5 (yellow). Non-myocardial nkx2.5+ second heart field (SHF) progenitors (red arrow) can be visualized in control animals (n=8), but are lacking in vgo mutants (n=7). EXPRESSION / LABELING:
|
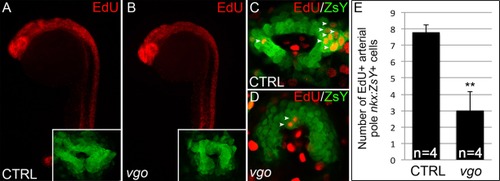
SHF progenitor cells fail to proliferate in the absence of Tbx1. A–D: Click-iT EdU labeling in 23ss Tg(nkx2.5:ZsYellow) vgo and control siblings. A,B: Flourescence microscopy images of EdU+ cells (red) in control (A) and vgo (B) embryos. 10× magnification, anterior up, dorsal right. Insets show flattened confocal images of ZsY+ cells comprising the cardiac cone. C,D: Composites of two confocal sections showing EdU+ cells (red) within the ZsYellow+ (green) SHF (white arrowheads). E: Graph depicting the average total numbers of EdU+, ZsYellow+ cells in confocal stacks of control (n=4) and vgo (n=4) embryos. EXPRESSION / LABELING:
PHENOTYPE:
|