
|
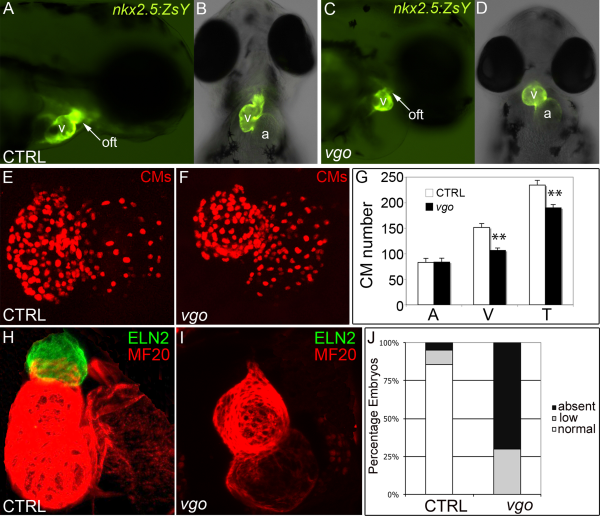
Fig. 2
tbx1 mutants display diminutive ventricles caused by decreased cardiomyocyte numbers and diminished OFT smooth muscle. A–D: Fluorescence microscopy images of Tg(nkx2.5:ZsYellow) control (CTRL) and vgo embryos; 10× magnification. At 72 hpf, the ventricular chamber and OFT appears small in vgo (C,D) compared to control (A,B). A,C: Lateral view, anterior right. B,D: Ventral view, anterior up. v = ventricle, a = atrium, oft = outflow tract. E,F: Flattened confocal images of cardiomyocyte (CM) nuclei in 72hpf Tg(cmlc2::DsRednuc) control (E) and vgo (F) hearts. G: Graph depicting the average number of CMs at 72hpf in control (n=4) and vgo (n=4) embryos. Asterisks indicate statistical significance as determined using unpaired Student′s t-test. Error bars represent +/ 1s.e.m. Atrial (A) CM numbers remain unchanged (P=0.47), while ventricular (V) and total (T) CM numbers are significantly lower in vgo mutants (P=0.00008 and 0.0002, respectively). H,I: Flattened confocal images following double immunofluorescence to visualize OFT smooth muscle precursors (Eln2; green) and chamber cardiomyocytes (MF20; red) in 72 hpf control (n=21; H) and vgo (n=20; I) embryos. J: Graph depicting the percentages of control or vgo embryos with normal low, or absent Eln2 staining.