
- Title
-
Ve-ptp Modulates Vascular Integrity by Promoting Adherens Junction Maturation
- Authors
- Carra, S., Foglia, E., Cermenati, S., Bresciani, E., Giampietro, C., Lora Lamia, C., Dejana, E., Beltrame, M., and Cotelli, F.
- Source
- Full text @ PLoS One
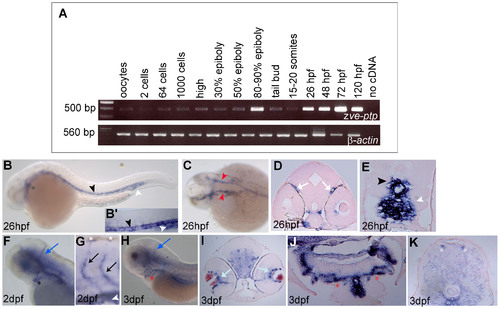
Spatio-temporal expression pattern of zve-ptp. (A) zve-ptp and β-actin temporal expression analysis is performed by qualitative RT-PCR analysis on total RNAs extracted from oocytes and different embryonic and larval stages (from 2 cells to 120 hpf). Negative control is showed in the right-most line. The sizes of the obtained PCR fragments are indicated. zve-ptp is expressed both maternally and zygotically during zebrafish development. (B–K) The zve-ptp spatial expression was analyzed by WISH at various developmental stages. Lateral (B) and dorsal (C) view of a 26 hpf embryo with anterior to the left; (B2) higher magnification of the tail shows the expression in the DA and CV. The transverse sections at the level of the head (D) and the tail (E) of a 26 hpf embryo labelled with zve-ptp probe show in detail the signal in head vessels and in the DA and CV. Lateral views of head (F) and magnification of the tail (G) of a 2 dpf embryo and lateral view of the head of a 3 dpf embryo (H). Cross sections at the level of head (I), aortic arches (J) and trunk (K) of a 3 dpf embryo. Black asterisk: AA1; black arrowhead: DA; white arrowhead: CV; red arrowhead: LDA; white arrows: vessels around the eyes; blue arrows: cranial vessels; black arrow: Se; red asterisks: aortic arches; light blue arrows: vessels around the lens; white asterisks: DLAVs. |
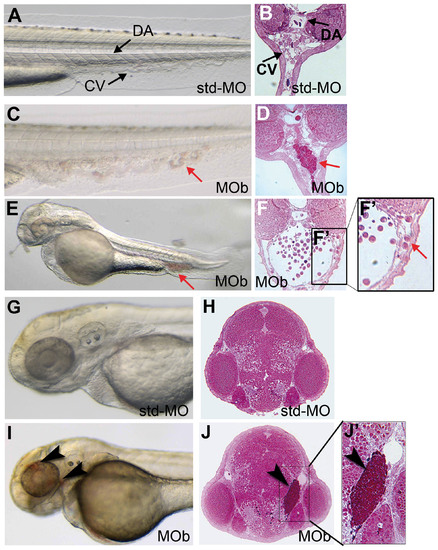
The zve-ptp MOb injection caused blood cell aggregates in the CV and head haemorrhages at 2 dpf. (A) Bright-field image and (B) cross section of the tail of a control embryo injected with std-MO. (C) Bright-field image and (D) cross section of the tail of an embryo injected with MOb showing blood aggregates in CV (red arrow). (E) Lateral view and (F) cross section at the level of the CV of a MOb injected embryo with a severe phenotype; (F2) higher magnification of the boxed area in F showing some blood elements out of the CV. (G) Bright-field image and (H) cross section of the head of a std-MO injected embryo. (I) Bright-field image and (J) cross section of the head of an embryo injected with MOb showing small haemorrhages (black arrowhead). (J2) Higher magnification of the boxed area in J showing blood accumulation in the tissues around the eye of zve-ptp morphant. Anterior to the left. DA: dorsal aorta; CV: caudal vein; red arrow: blood aggregates; black arrowhead: haemorrhage. PHENOTYPE:
|
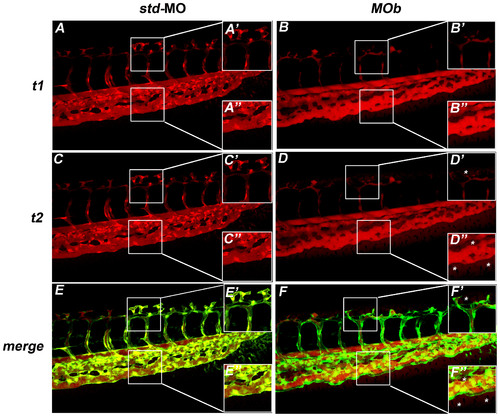
The zve-ptp MOb injection caused an increase in vascular permeability. (A–D) Microangiographies were performed on tg(fli1:EGFP)y1 embryos at 2 dpf by the injection of dextran-TMR (tetramethylrhodamine; molecular weight 70 kDa). All microinjected embryos presented blood circulation. Confocal images of tail vessels of std-MO (A, C) and MOb injected embryos (B, D) at t1 = 10 minutes (A, B) and t2 = 15 minutes (C, D). (E, F) Merge of the images at t2 of embryos injected with std-MO and MOb with the respective images of the tail vessels obtained using tg(fli1:EGFP)y1 line. (A2–F2 A3–F3) Higher magnifications of the respective boxed areas. Asterisks: dye extravasation. PHENOTYPE:
|
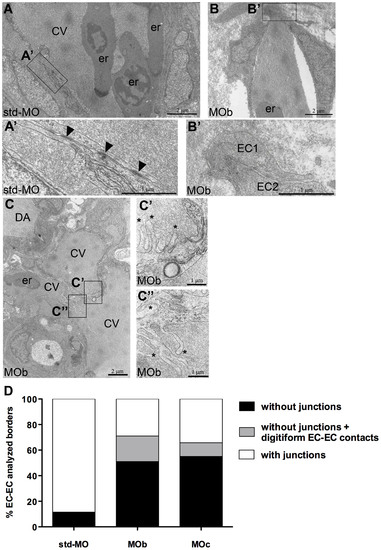
Ultrastructural defects in endothelial cells of zve-ptp morphants at 2 dpf. (A–C) Electron microscopy at the level of the CV plexus of a std-MO (A) and a MOb injected embryo (B, C). (A2–C2, C3) Higher magnifications of the respective boxed areas. (A2) Numerous and extensive junctional complexes are visible in a control embryo. (B2) No junctional complexes are detectable between two ECs in a morphant. All analyzed embryos presented blood circulation. Arrowheads: junctional complexes; asterisks: digitiform EC-EC contact; CV: caudal vein; er: erythrocytes; DA: dorsal aorta; EC: endothelial cell. (D) Quantitative analysis of % EC-EC borders with any type of junctions (adherens and/or tight junctions), without junctions and without junctions but with digitiform EC-EC contacts in controls and in zve-ptp morphants. The graph shows the analysis performed on the acquired images of trunk and tail regions of MOb and MOc injected embryos. We analyzed 112, 150 and 280 EC-EC borders out of three std-MO, seven zve-ptp MOb and five zve-ptp MOc independent injected embryos respectively. PHENOTYPE:
|
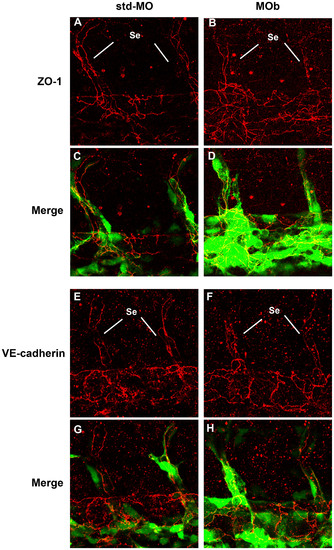
Immunofluorescence analysis by confocal microscopy of endothelial intercellular junctions. Immunofluorescence experiments were performed on tg(fli1:EGFP)y1 embryos at 2 dpf. Confocal images of tail vessels of std-MO (A, E) and MOb injected embryos (B, F) labeled with an anti-ZO-1 and VE-cadherin antibody (red) and the respective merged images (C, D, G, H). Se: intersegmental vessels. EXPRESSION / LABELING:
|
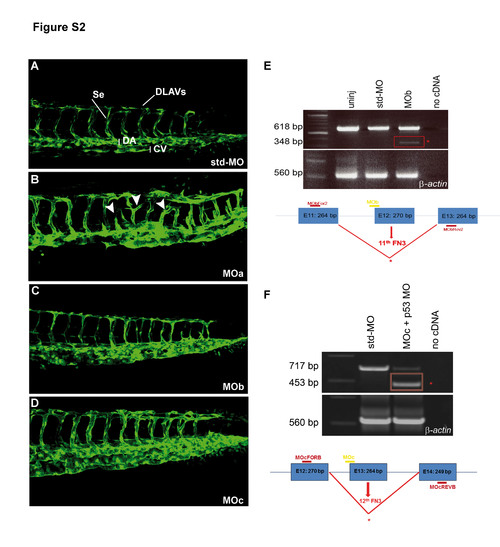
The zve-ptp MOa injection caused angiogenic defects at 2 dpf. (A�D) Confocal images of the tail of tg(fli1:EGFP)y1 embryos injected with std-MO (A), zve-ptp MOa (B), zve-ptp MOb (C) and zve-ptp MOc (D). Embryos injected with MOa display intersomitic vessels which are either truncated or characterized by anomalous branching (white arrowhead). Se: intersomitic vessels; DLAVs: dorsal longitudinal anastomotic vessels; DA: dorsal aorta; CV: caudal vein. (E�F) The efficiency of splice-blocking is tested by RT-PCR with primers designed on the exons flanking the MO target site. The injection of selected doses of splice-blocking MOs (0.5 pmol/embryo of MOb and co-injection of 0.2 pmol/embryo of MOc with 0.3 pmol/embryo of p53 MO) resulted in the presence of the expected wild-type fragment and the generation of an additional smaller band (red box) corresponding to an aberrant transcript. The sizes of the obtained PCR fragments are indicated. Diagrams in E and F show the position of the zve-ptp MOb (MOb; designed on the intron 11/exon 12 boundary), the position of the zve-ptp MOc (MOc; designed on the intron 12/exon 13 boundary) and the position of the specific primers (MObFOR2-MObREV2 and MOcFORB-MOcREVB). Boxes represent exons (E11 to E14). The size of each exon is indicated in the respective box. |
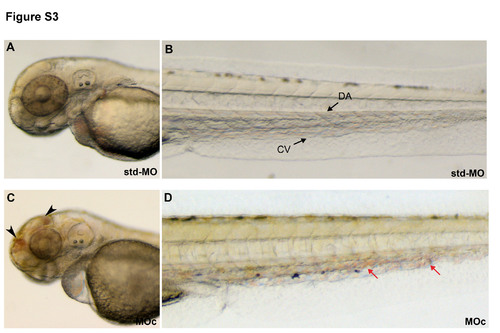
zve-ptp MOc injection gave qualitatively similar results to MOb injection, such as head haemorrhages and blood cell accumulations in the CV at 2 dpf. Bright-field images of the head and the tail of std-MO (A, B) and zve-ptp MOc injected embryos (C, D). MOc morphants showed small haemorrhages (black arrowhead) in the head (C) and small blood aggregates (red arrows) in CV (D). Anterior to the left. DA: dorsal aorta; CV: caudal vein; black arrowhead: haemorrhage; red arrow: blood aggregates. |
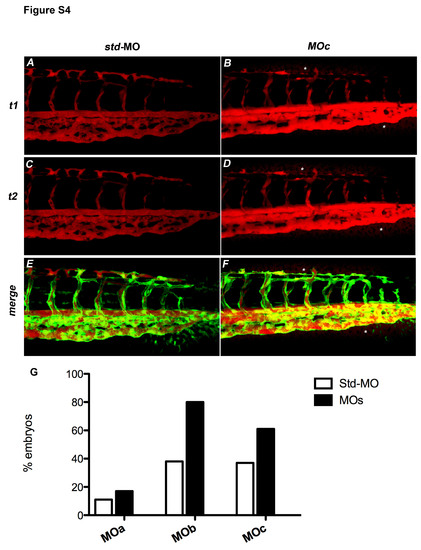
The zve-ptp MOc injection caused an increase in vascular permeability. (A�D) Microangiographies were performed on tg(fli1:EGFP)y1 embryos at 2 dpf by the injection of dextran-TMR (tetramethylrhodamine; molecular weight 70 kDa). All microinjected embryos presented blood circulation. Confocal images of tail vessels of std-MO (A, C) and MOc injected embryos (B, D) at t1 = 10 minutes (A, B) and t2 = 15 minutes (C, D). (E, F) Merge of the images at t2 of embryos injected with std-MO and MOc with the respective images of the tail vessels obtained using tg(fli1:EGFP)y1 line. Asterisks: dye extravasation. (G) Histogram shows the percentage of embryos injected with MOa, MOb and MOc that showed dye extravasation with respect to std-MO injected embryos. |
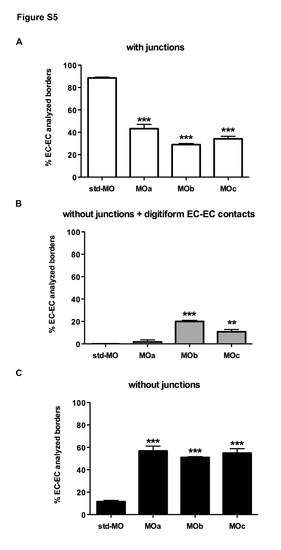
Statistical analysis of EC-EC borders in zve-ptp MOa, MOb and MOc injected embryos. Quantitative analysis of (A), without junctions but with digitiform EC-EC contacts (B) and without junctions (C) in controls and in zve-ptp MOa, performed on the TEM acquired images of trunk and tail regions out of three std-MO and five zve-ptp MOa, seven MO with a total of 112, 221, 150 and 280 EC-EC borders analyzed respectively. *** p<0.001 vs std-MO; ** p<0.01 vs std- PHENOTYPE:
|