
Image
|
Figure Caption
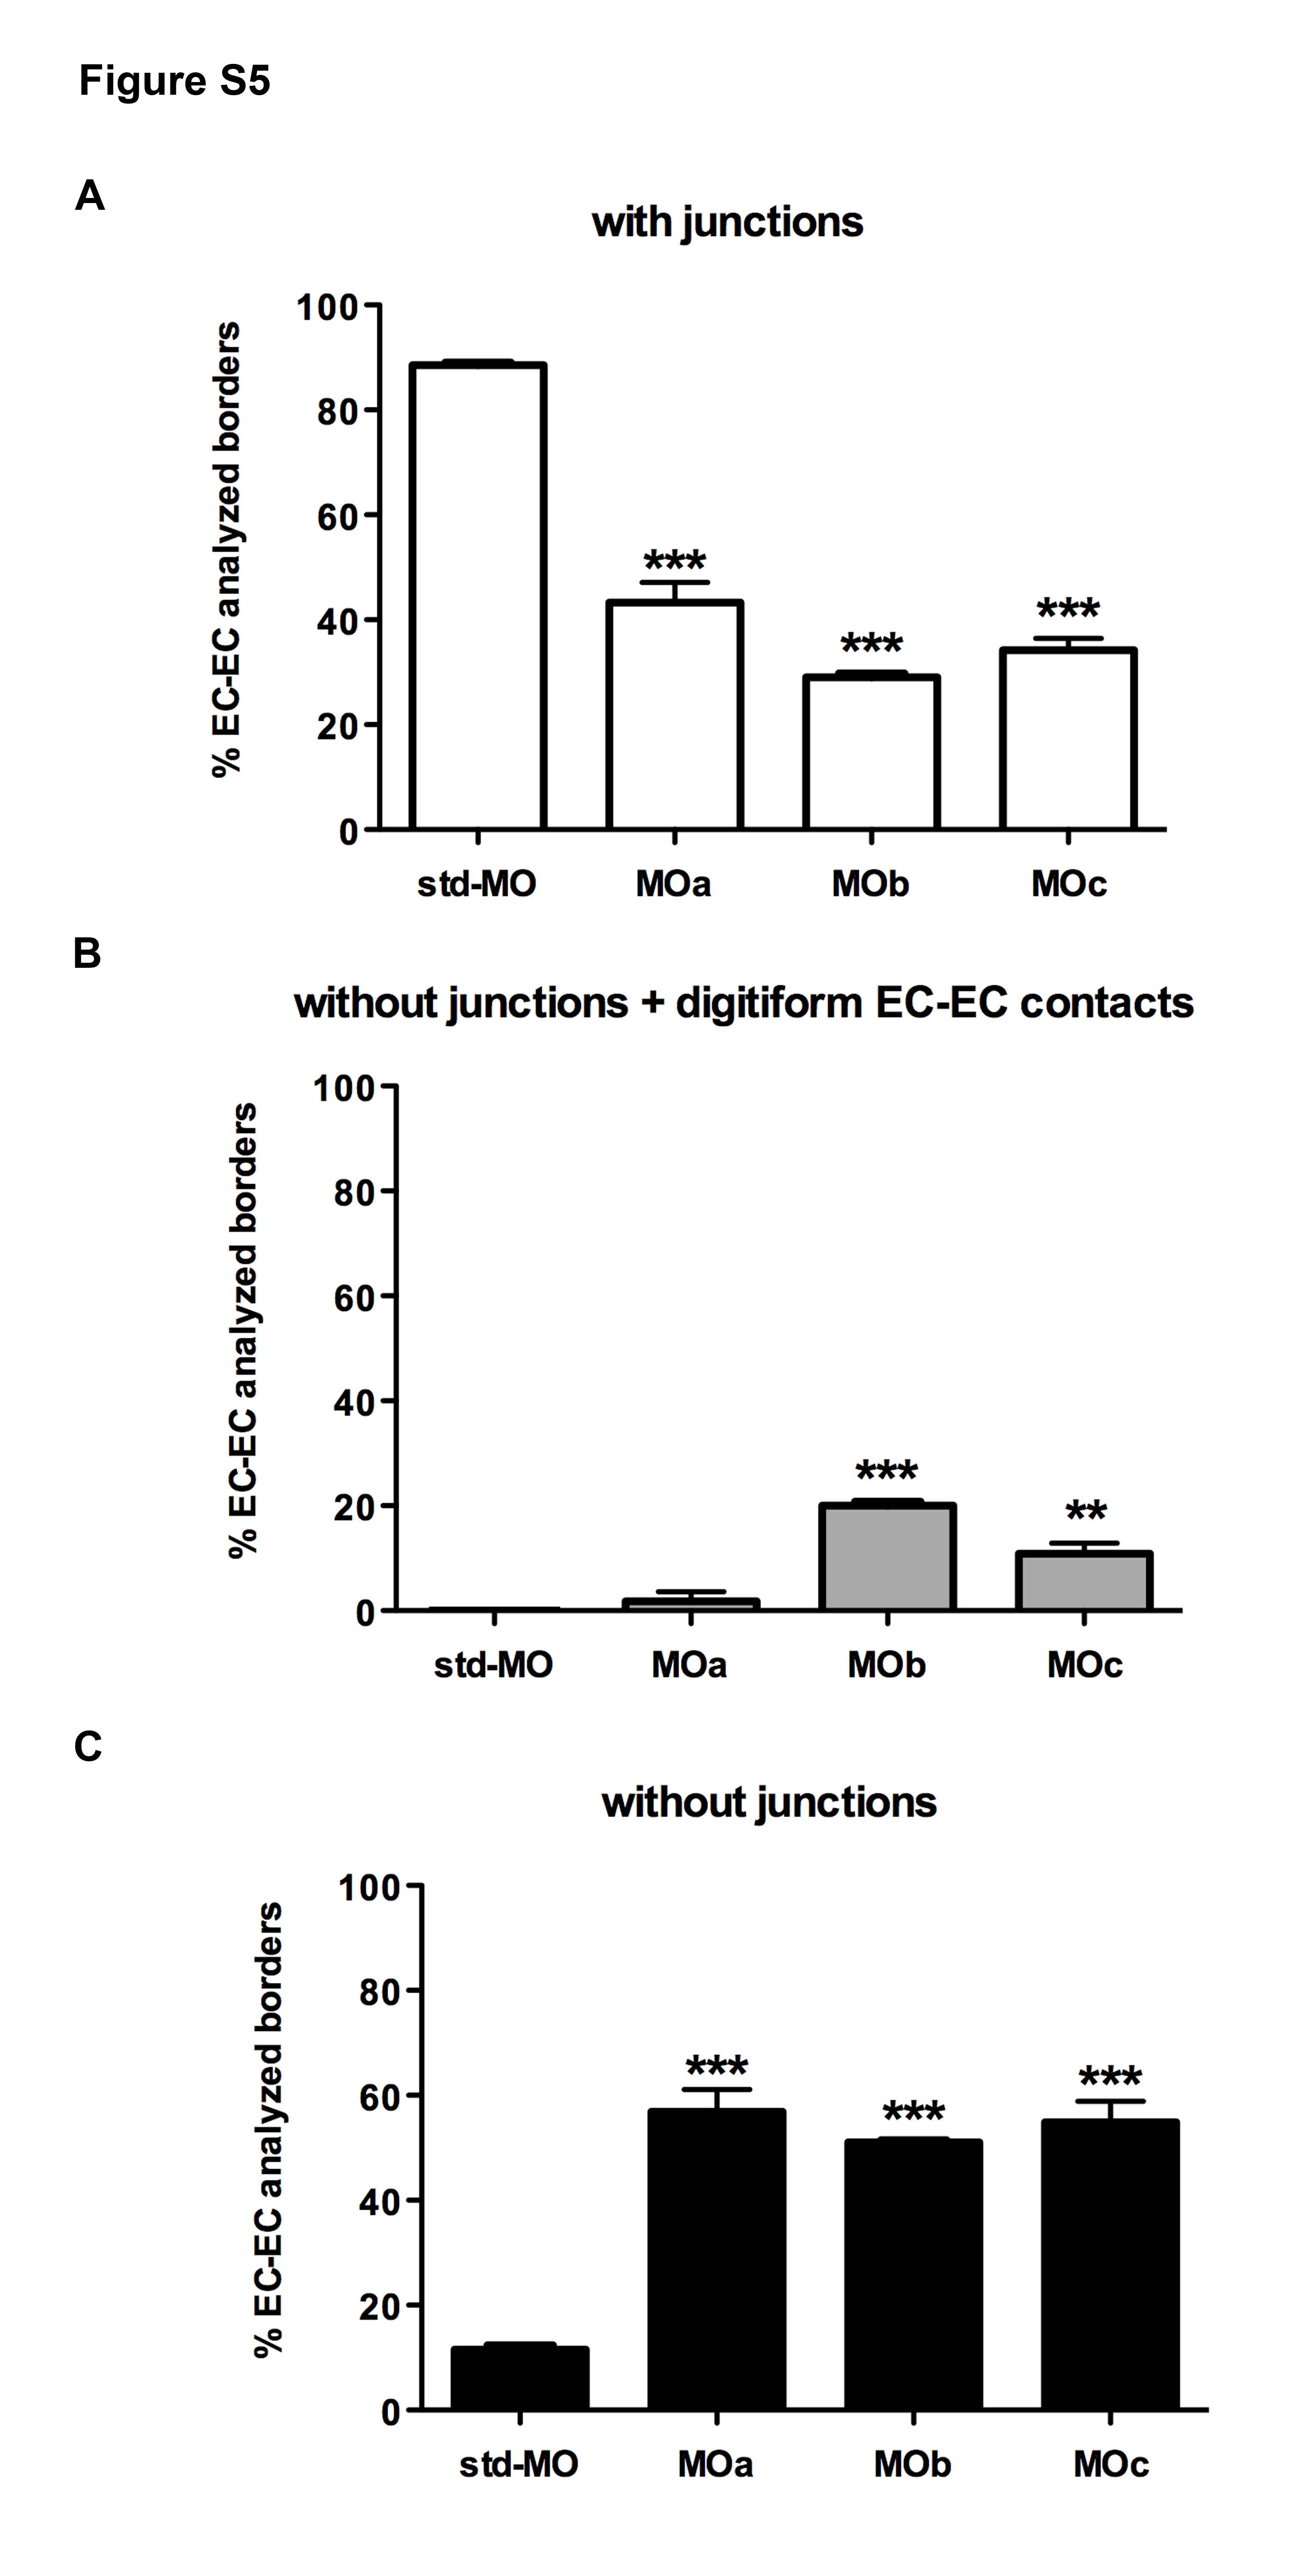
Fig. S5
Statistical analysis of EC-EC borders in zve-ptp MOa, MOb and MOc injected embryos. Quantitative analysis of (A), without junctions but with digitiform EC-EC contacts (B) and without junctions (C) in controls and in zve-ptp MOa, performed on the TEM acquired images of trunk and tail regions out of three std-MO and five zve-ptp MOa, seven MO with a total of 112, 221, 150 and 280 EC-EC borders analyzed respectively. *** p<0.001 vs std-MO; ** p<0.01 vs std-
Figure Data
Acknowledgments
This image is the copyrighted work of the attributed author or publisher, and
ZFIN has permission only to display this image to its users.
Additional permissions should be obtained from the applicable author or publisher of the image.
Full text @ PLoS One