
|
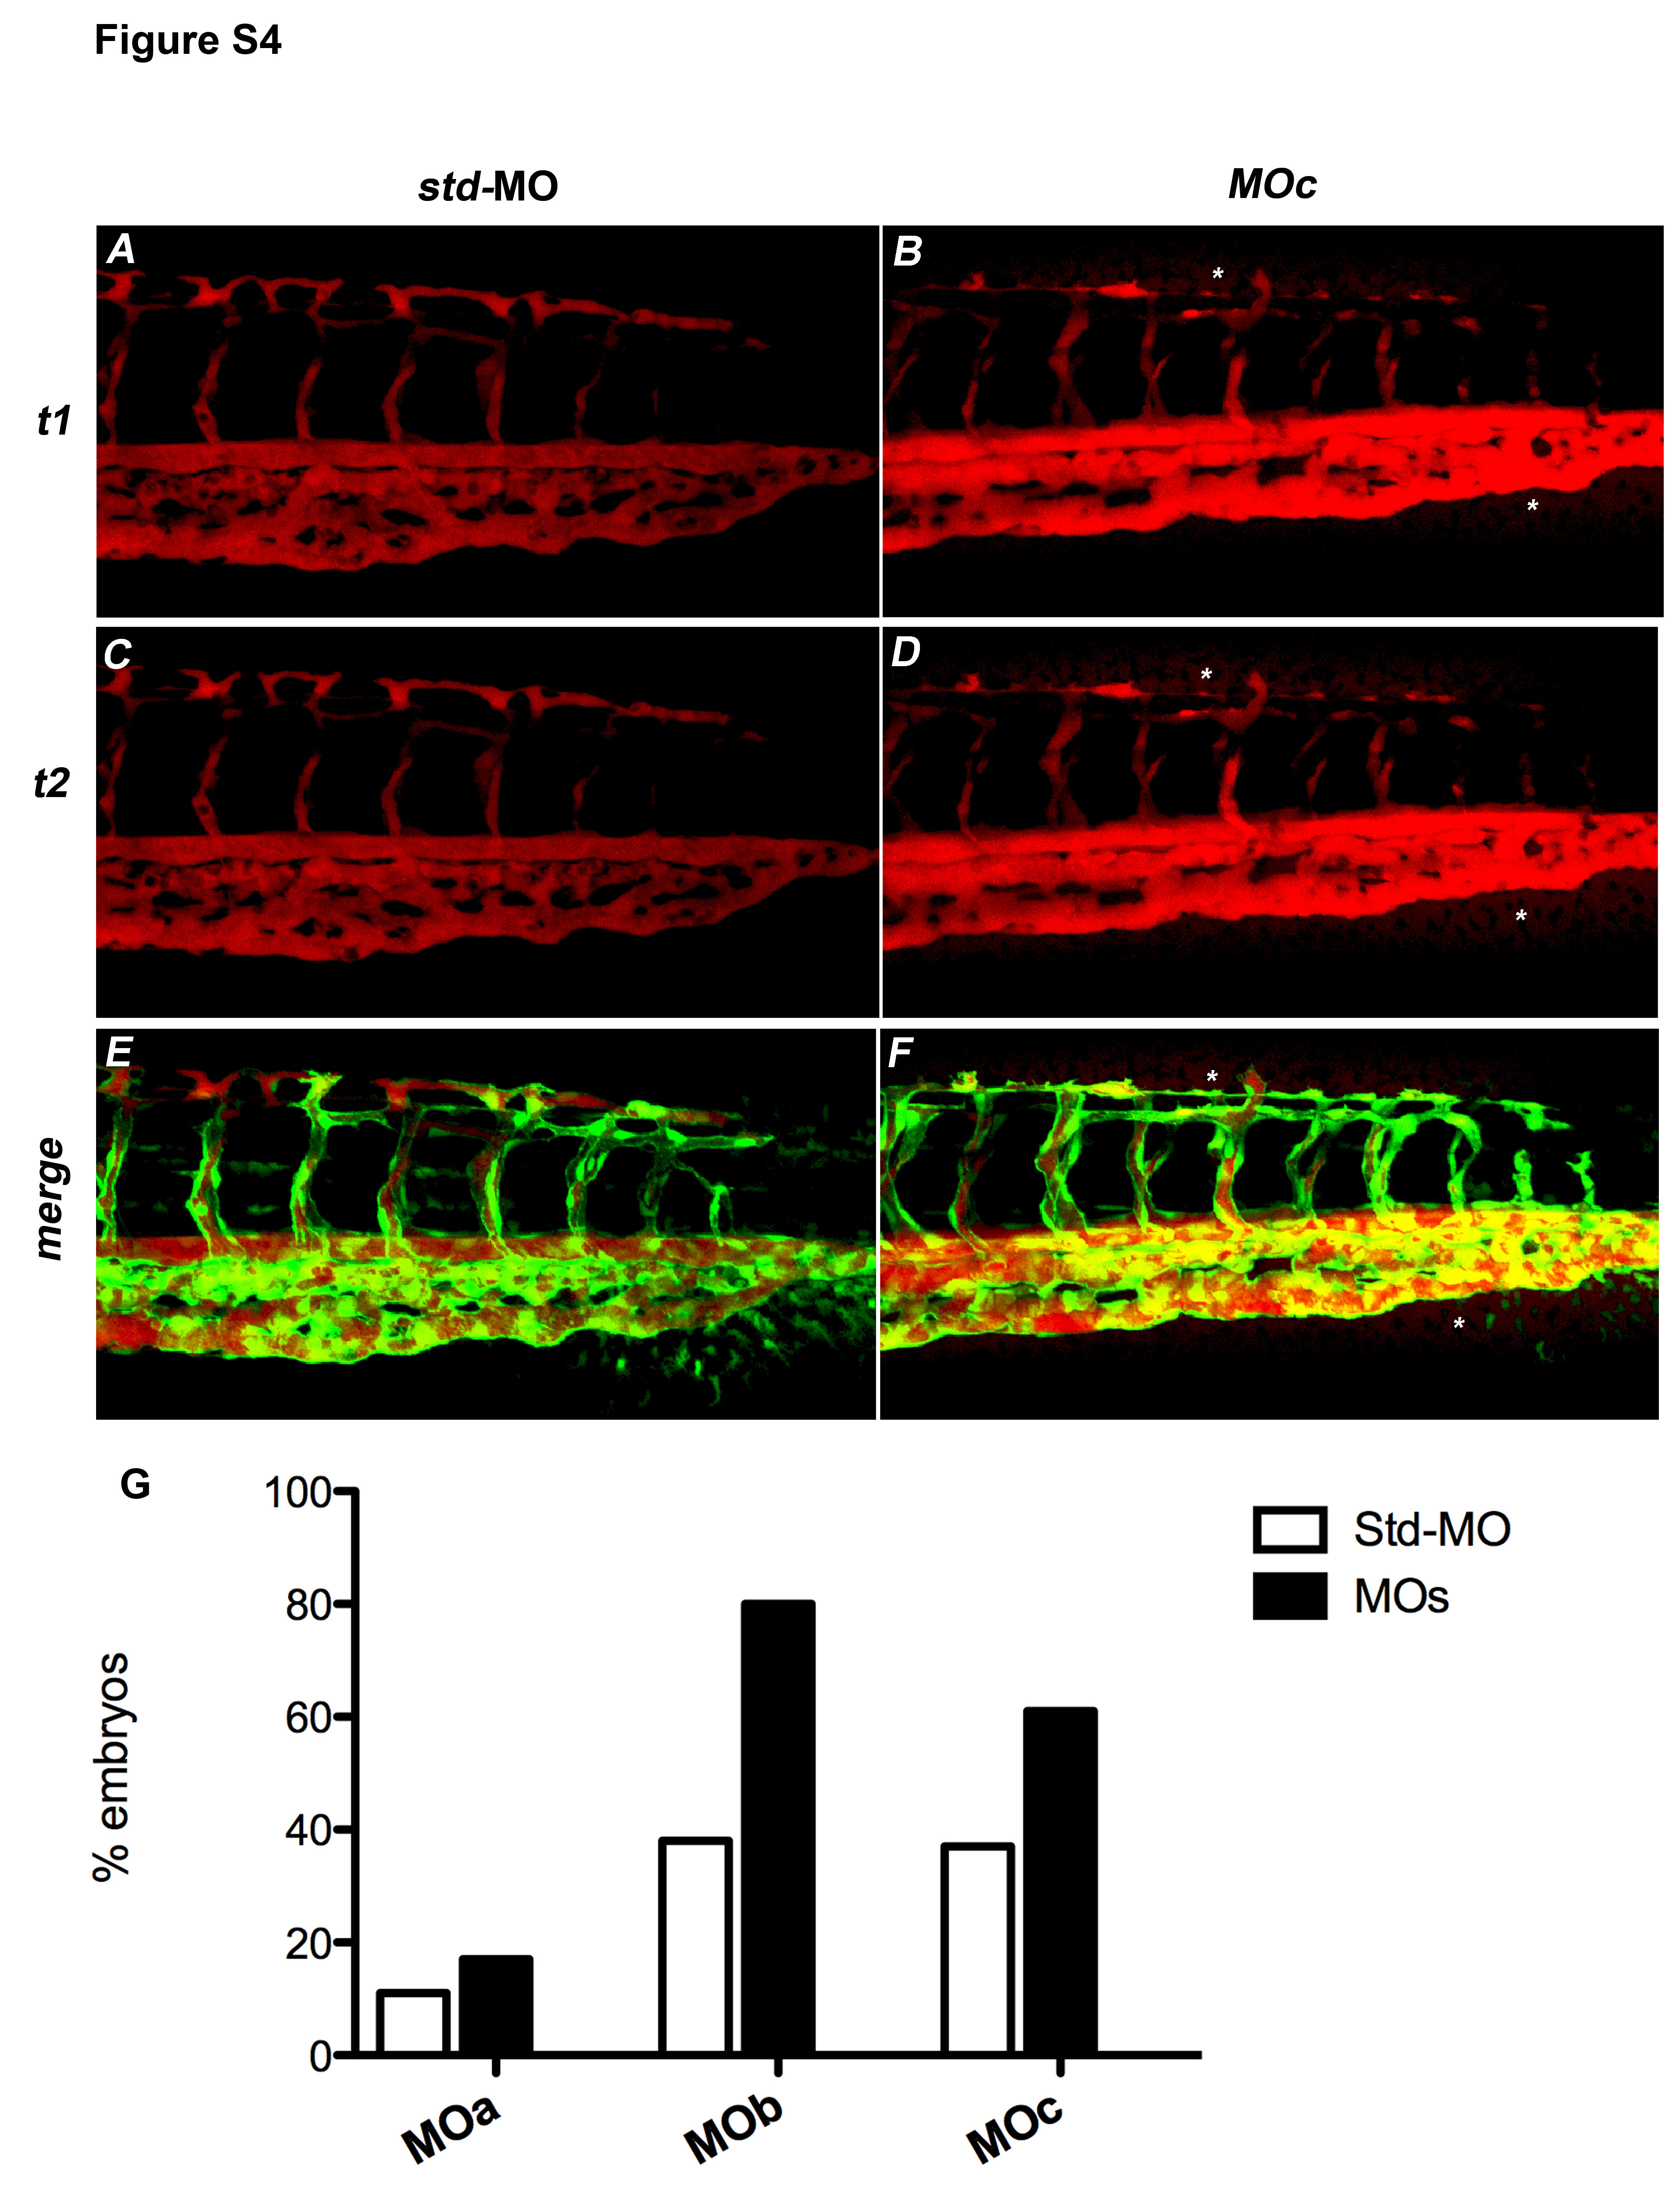
Fig. S4 The zve-ptp MOc injection caused an increase in vascular permeability. (A�D) Microangiographies were performed on tg(fli1:EGFP)y1 embryos at 2 dpf by the injection of dextran-TMR (tetramethylrhodamine; molecular weight 70 kDa). All microinjected embryos presented blood circulation. Confocal images of tail vessels of std-MO (A, C) and MOc injected embryos (B, D) at t1 = 10 minutes (A, B) and t2 = 15 minutes (C, D). (E, F) Merge of the images at t2 of embryos injected with std-MO and MOc with the respective images of the tail vessels obtained using tg(fli1:EGFP)y1 line. Asterisks: dye extravasation. (G) Histogram shows the percentage of embryos injected with MOa, MOb and MOc that showed dye extravasation with respect to std-MO injected embryos.