
|
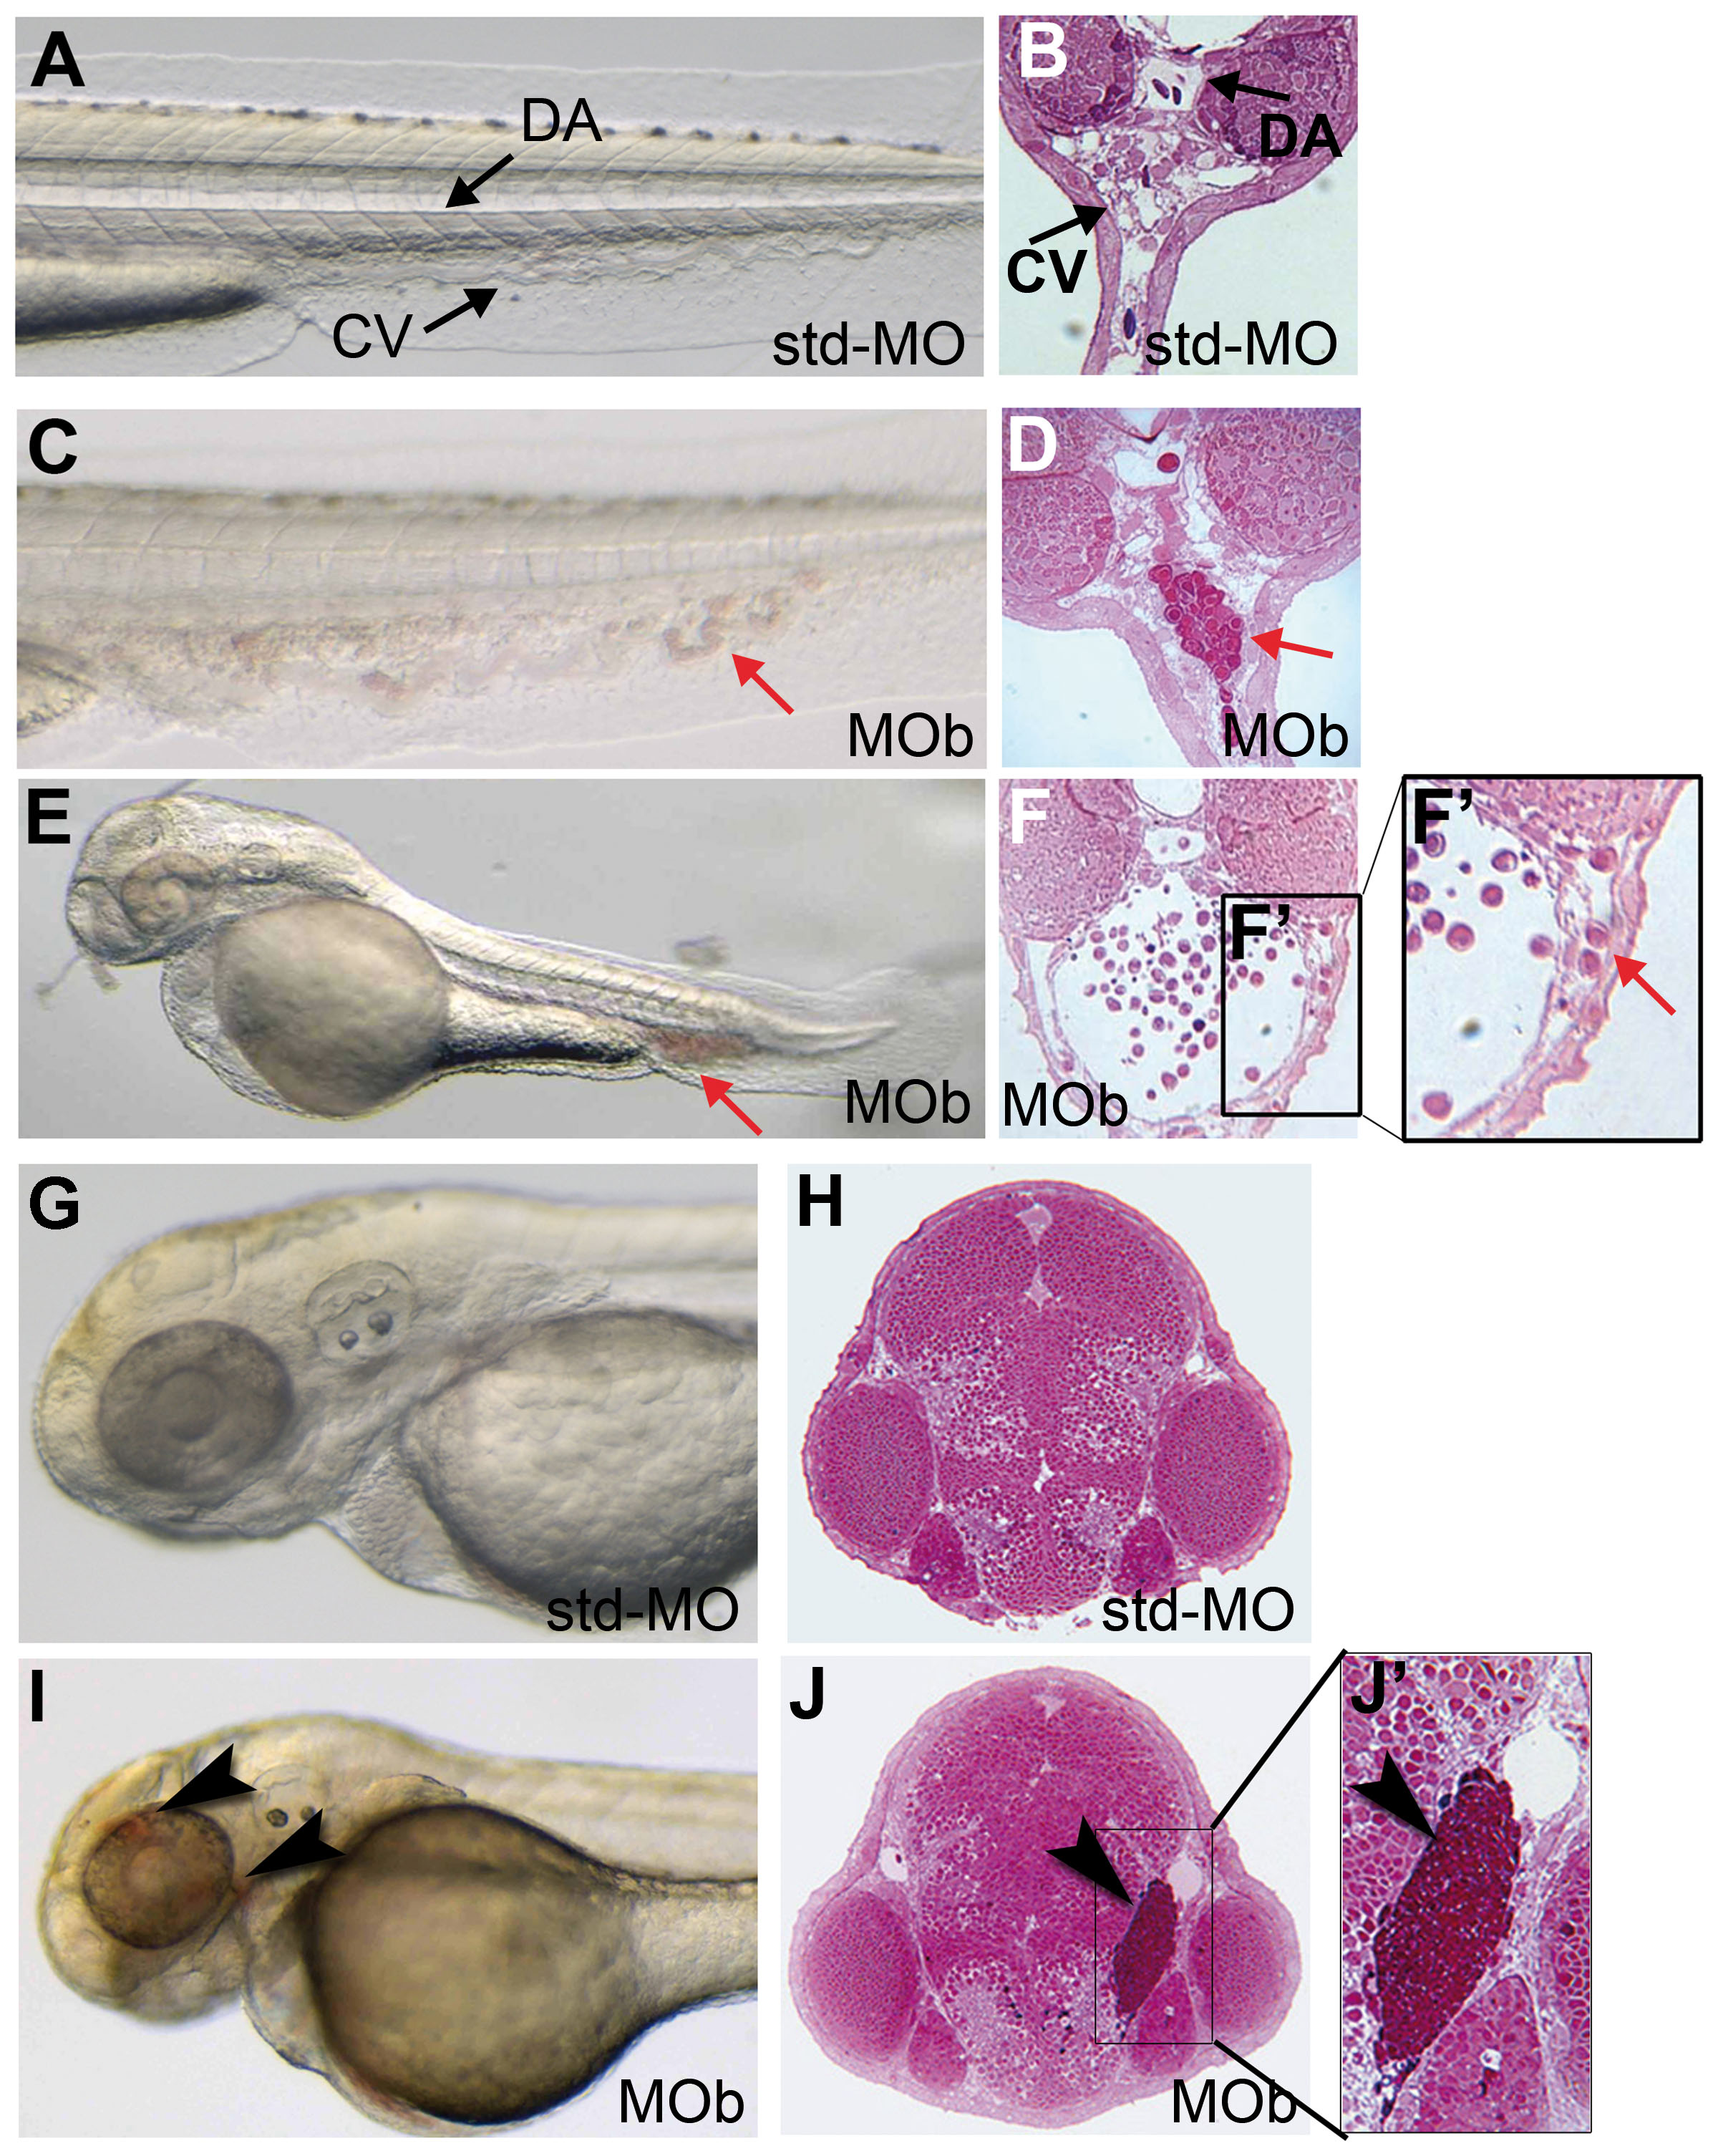
Fig. 3 The zve-ptp MOb injection caused blood cell aggregates in the CV and head haemorrhages at 2 dpf.
(A) Bright-field image and (B) cross section of the tail of a control embryo injected with std-MO. (C) Bright-field image and (D) cross section of the tail of an embryo injected with MOb showing blood aggregates in CV (red arrow). (E) Lateral view and (F) cross section at the level of the CV of a MOb injected embryo with a severe phenotype; (F2) higher magnification of the boxed area in F showing some blood elements out of the CV. (G) Bright-field image and (H) cross section of the head of a std-MO injected embryo. (I) Bright-field image and (J) cross section of the head of an embryo injected with MOb showing small haemorrhages (black arrowhead). (J2) Higher magnification of the boxed area in J showing blood accumulation in the tissues around the eye of zve-ptp morphant. Anterior to the left. DA: dorsal aorta; CV: caudal vein; red arrow: blood aggregates; black arrowhead: haemorrhage.