
- Title
-
Basal bodies exhibit polarized positioning in zebrafish cone photoreceptors
- Authors
- Ramsey, M., and Perkins, B.D.
- Source
- Full text @ J. Comp. Neurol.
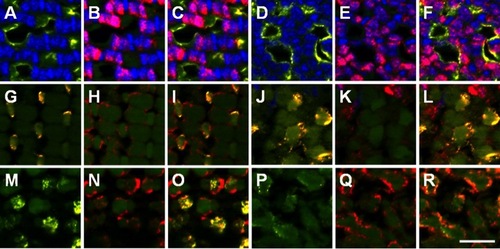
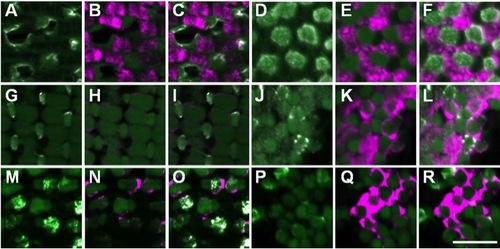
Cone subtypes can be identified by the vertical tiering distribution. A–F: UV opsin (yellow) marks UV-sensitive cones, and zpr-1 staining (red) marks the cell bodies of the red-/green-sensitive double cones in the adult mosaic (A-C) and the larval retina (D-F) at the vertical location of the basal body. G-L: Blue opsin (yellow) labels blue-sensitive cones, and zpr-1 staining (red) labels red-/green-double cones in the adult mosaic (G-I) and the larval retina (J-L) at the vertical location of the basal bodies. M-R: Green cone opsin (yellow) labels green-sensitive cones and colocalizes with one member of the double-cone pair labeled by zpr-1 staining (red) in the adult mosaic (M-O) and the larval retina (P–R). A magenta-green version of this figure is provided in the Supporting Information. Scale bar = 10 μm. |
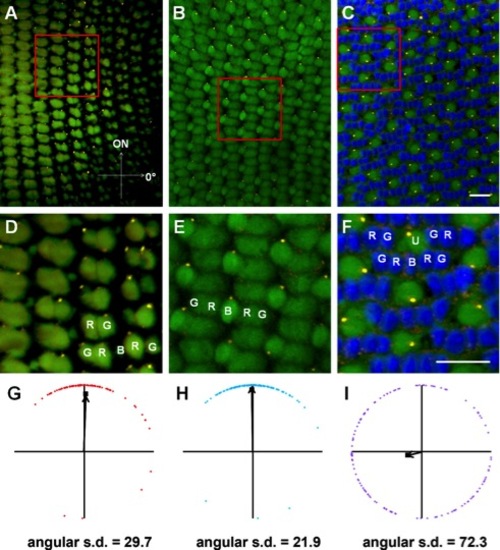
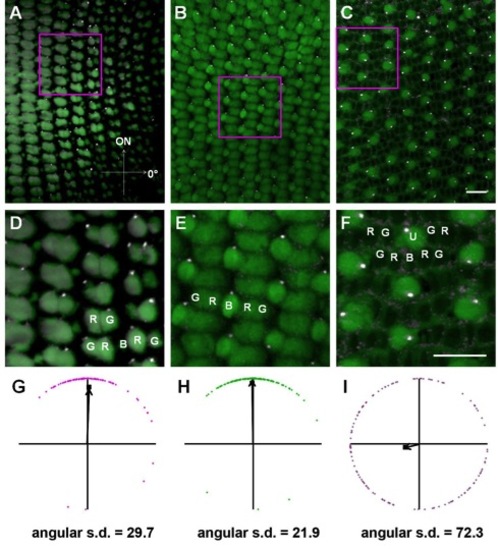
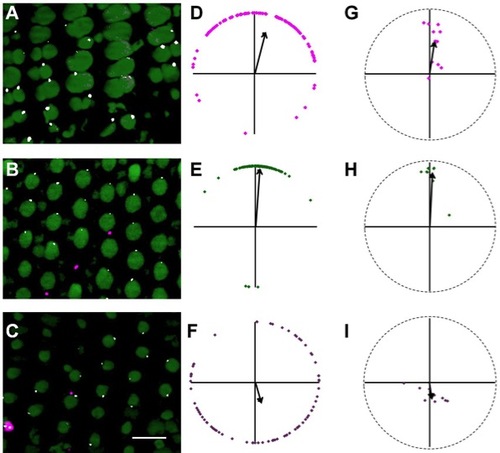
Basal body positioning is strongly patterned in individual fields of red-/green- and blue-sensitive cones. Sample portions of fields of cells at the depths of the basal bodies of red-/green-sensitive cones (A), blue-sensitive cones (B), and UV-sensitive cones (C), along with their magnified subsets of cells (D-F), in adult light-adapted zebrafish retinas. γ-Tubulin localized to basal bodies (yellow), whereas nuclei were counterstained with DAPI (blue). Autofluorescence (green) from 488-nm excitation shows inner and outer segments. Some red-, green-, blue-, and UV-sensitive cones are labeled as R, G, B, and U, respectively. G-I: Graphs of the positions of basal bodies from fields A–C in which the positions of all the basal bodies of red-/green-, blue-, or UV-sensitive cones were plotted around a unit circle (red, blue, or purple lozenges, respectively), and the mean vector is indicated (black arrow). The angular position of each mean vector indicates the basal bodies′ mean position around the periphery of the cell, and the distance of each mean vector from the origin indicates the strength of the trend. Optic nerve is upward in all panels. A magenta-green version of this figure is provided in the Supporting Information. Scale bars = 10 μm in C (applies to A-C); 10 μm in F (applies to D–F). EXPRESSION / LABELING:
|
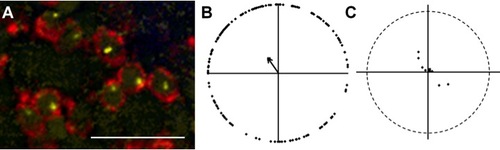
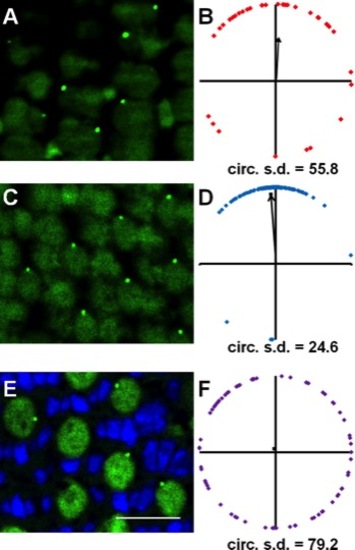
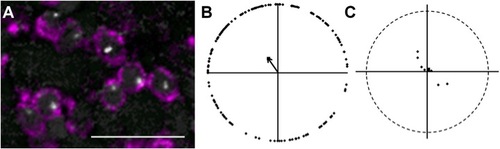
Rod basal bodies are randomly positioned. A: Basal bodies of rod photoreceptors within the mosaic of a dark-adapted retina. GFP immunoreactivity (red) labels rods in the XOPS-GFP line. γ-Tubulin (yellow) localizes to basal bodies. Nuclei were stained with DAPI (blue). Autofluorescence at 488 nm (green) shows inner and outer segments. B: Graphic analysis of rod basal bodies from an individual field of cells. The mean vector is indicated as a black arrow. C: Plot showing the mean vectors from several individual fields of rods (lozenges) and the grand mean vector of these mean vectors (square). The optic nerve is upward in all panels, and all fields analyzed were from the middle or peripheral retina. A magenta-green version of this figure is provided in the Supporting Information. Scale bar = 10 μm. EXPRESSION / LABELING:
|
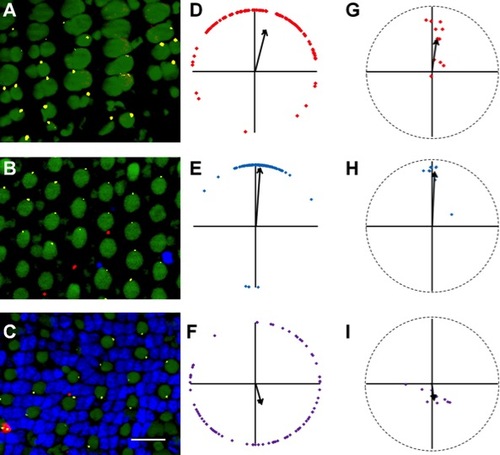
Loss of rods does not affect basal body positioning in cones. Sample portions of fields of cells at the depths of the basal bodies of red-/green-sensitive cones (A), blue-sensitive cones (B), and UV-sensitive cones (C) show basal body positioning in adult light-adapted XOPS-mCFP zebrafish retinas. D-F: Graphs of the positions of basal bodies from fields A-C in which the positions of all the basal bodies of red-/green-, blue-, or UV-sensitive cones were plotted around a unit circle (red, blue, or purple lozenges, respectively), and the mean vector is indicated (arrow). G-I: Mean vectors of basal bodies from individual fields of red-/green-, blue-, and UV-sensitive cones are plotted (red, blue, and purple lozenges, respectively). The grand mean vector of these mean vectors is indicated (arrow). Optic nerve is upward in all panels. Small numbers of remaining rods are occasionally visible (red). β-Tubulin (yellow) localizes to basal bodies. Nuclei were stained with DAPI (blue). Autofluorescence at 488 nm (green) shows inner and outer segments. All fields analyzed were from the middle retina. A magenta-green version of this figure is provided in the Supporting Information. Scale bar = 10 μm. EXPRESSION / LABELING:
|
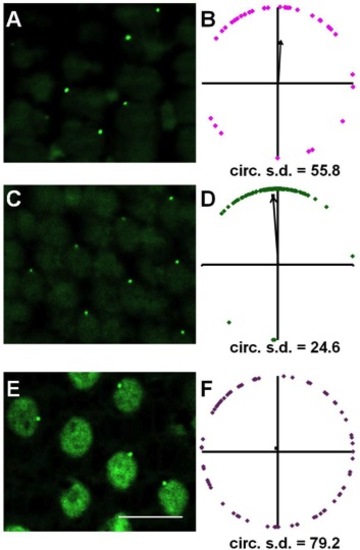
Centrin-GFP labels basal bodies in the retinas of adult Tg(XlRho:gap43-CFP)ucd1 transgenic zebrafish. Sample portions of fields of cells at the depths of the basal bodies of red-/green-sensitive cones (A), blue-sensitive cones (C), and UV-sensitive cones (E). GFP fluorescence localized to basal bodies (green), and nuclei were counterstained with DAPI (blue). Autofluorescence (green) from 488-nm excitation shows inner and outer segments. B,D,F: Graphs of the positions of basal bodies from fields A,C,E in which the positions of all the basal bodies of red-/green-, blue-, or UV-sensitive cones were plotted around a unit circle (red, blue, or purple lozenges, respectively), and the mean vector is indicated (arrow). Optic nerve is upward in all panels. A magenta-green version of this figure is provided in the Supporting Information. Scale bar = 10 μm. EXPRESSION / LABELING:
|
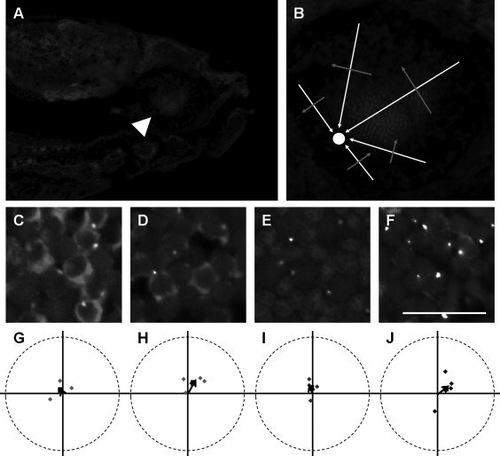
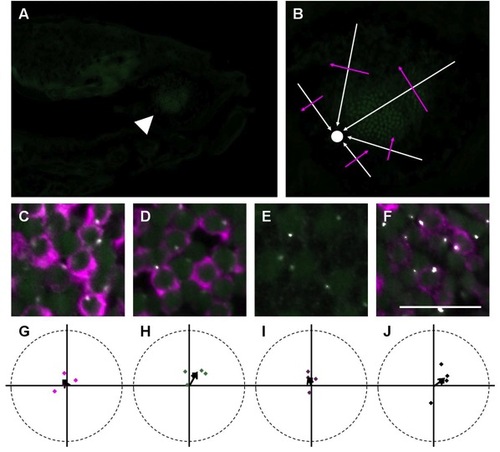
Larval photoreceptor basal bodies are randomly positioned. A: Sagittal section through a 7-dpf Tg(-5actb2:cetn2-GFP)cu6 larvae shows the optic nerve (arrowhead) and larval retinal mosaic (arrow). B: Enlarged view of sectioned retina shows how to determine the orientation of cells relative to the optic nerve (circle). White arrows indicate the direction of the optic nerve, whereas red arrows indicate the 90° perpendicular angle. C,D: Immunostaining with zpr-1 (red) and GFP (yellow) antibodies identifies basal bodies in red-/green-sensitive cones. Blue-sensitive cones were negative for zpr-1 and 4C12 immunoreactivity (arrows). E: Inner and outer segments (autofluorescence from excitation with 488-nm light) and basal bodies (yellow) of UV-sensitive cones. F: Basal bodies (yellow) and 4C12 (red)-immunopositive rods. G-J: Mean angular positions of individual fields of red-/green-, blue-, and UV-sensitive cones and rods are plotted on circular graphs. Grand mean angular positions are shown as black squares. In all images, nuclei are counterstained with DAPI (blue). A magenta-green version of this figure is provided in the Supporting Information. Scale bar = 10 μm (C-F). [Color figure can be viewed in the online issue, which is available at wileyonlinelibrary.com.] EXPRESSION / LABELING:
|
|
|
|
|
|
|