
|
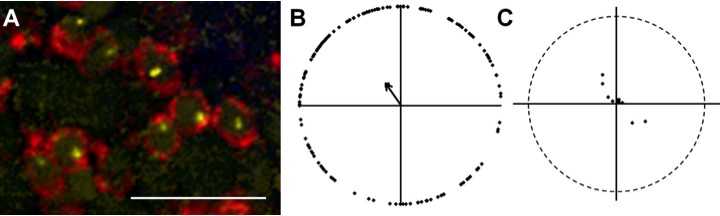
Fig. 5 Rod basal bodies are randomly positioned. A: Basal bodies of rod photoreceptors within the mosaic of a dark-adapted retina. GFP immunoreactivity (red) labels rods in the XOPS-GFP line. γ-Tubulin (yellow) localizes to basal bodies. Nuclei were stained with DAPI (blue). Autofluorescence at 488 nm (green) shows inner and outer segments. B: Graphic analysis of rod basal bodies from an individual field of cells. The mean vector is indicated as a black arrow. C: Plot showing the mean vectors from several individual fields of rods (lozenges) and the grand mean vector of these mean vectors (square). The optic nerve is upward in all panels, and all fields analyzed were from the middle or peripheral retina. A magenta-green version of this figure is provided in the Supporting Information. Scale bar = 10 μm.