
- Title
-
Parametric functional maps of visual inputs to the tectum
- Authors
- Nikolaou, N., Lowe, A.S., Walker, A.S., Abbas, F., Hunter, P.R., Thompson, I.D., and Meyer, M.P.
- Source
- Full text @ Neuron
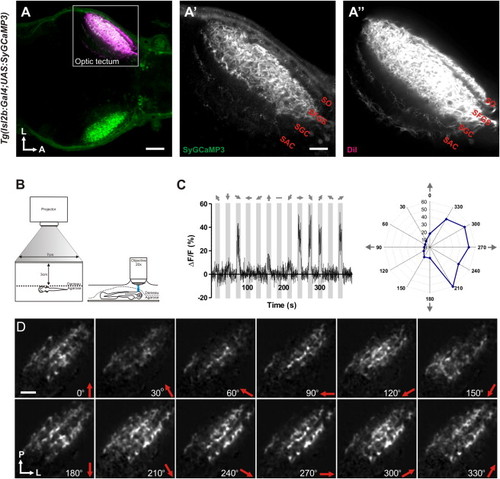
SyGCaMP3 Transgenic Zebrafish and Experimental Set-Up(A–A′′) Dorsal view of a 7 dpf double transgenic Tg(Isl2b:Gal4;UAS:SyGCaMP3) zebrafish larva showing SyGCaMP3 expression in RGC axons within the tectal neuropil. DiI, injected into the right eye, labels RGC axons throughout all retinorecipient laminae in the left tectal hemisphere. Boxed region is magnified in (A′) and (A′′) (SO, stratum opticum; SFGS, stratum fibrosum et griseum superficiale; SGC, stratum griseum centrale; SAC, stratum album centrale) (L, lateral; A, anterior). (B) Larvae were immobilized in agarose and placed with one eye facing a projection screen. Visually evoked SyGCaMP3 responses were recorded in the contralateral tectum. (C) Representative percentage ΔF/F of a single voxel during a tuning experiment. Stimulus epochs are shown in gray and direction of motion is indicated by arrows. Integral responses in polar plot form are shown to the right. (D) Montage showing integral responses (grayscale) of all voxels (RGC axons) in the tectum. Direction of motion is shown on the bottom right in each panel. Orientation of the image is shown on the bottom left (P, posterior; L, lateral). Scale bars represent 50 μm in (A), 20 μm in (A′), and 20 μm in (D). |
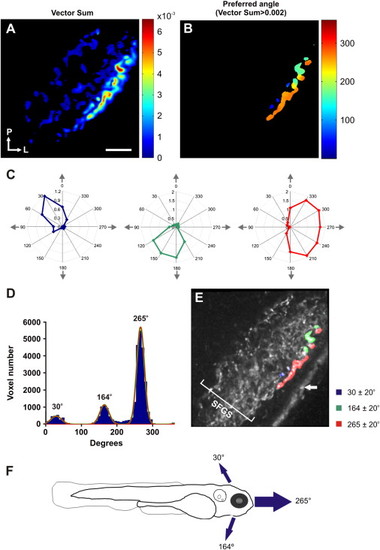
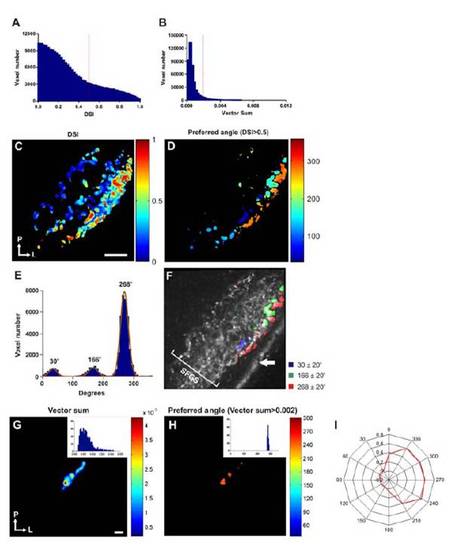
Direction-Selective Responses Are Restricted to a Superficial Layer of SFGS(A) Voxel-wise vector sum analysis of a single larva. Voxels are color coded according to vector sum (scale shown to the right). (B) A threshold (vector sum > 0.002) applied to the map shown in (A) reveals direction-selective voxels localized to superficial regions of the tectal neuropil. Color coding represents the preferred angle. (C) Polar plots of representative voxels with highly direction-selective responses (color coding as in B). (D) Distribution of vector angles for all direction-selective voxels (23 optical sections from 9 larvae). Fitted von-Mises distributions confirm three populations of direction-selective voxels centered at 30°, 164°, and 265°. (E) Parametric map of a single larva illustrating the three populations of direction-selective responses superimposed onto the mean fluorescence image of SyGCaMP3-expressing axons. Direction-selective responses occur in a superficial layer of SFGS. White arrow indicates skin autofluorescence. (F) Preferred angles of direction-selective responses relative to the larval body axis. Arrows are scaled to reflect the relative proportion of voxels in each population. Scale bar represents 20 μm in (A), as well as in (B) and (E). |
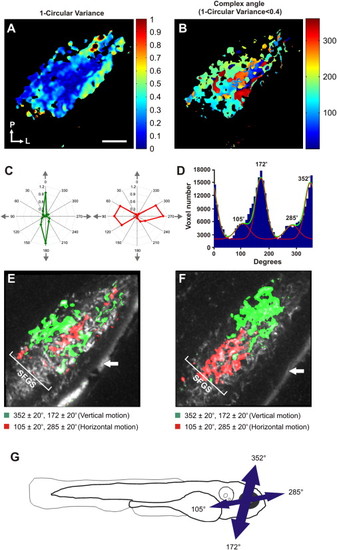
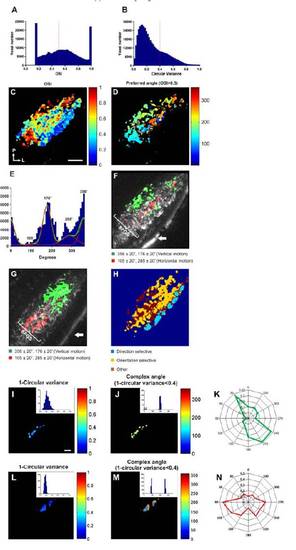
Orientation-Selective Responses Are Broadly Distributed throughout SFGS(A) Voxel-wise analysis of 1 circular variance from a single larva. Voxels are color coded according to 1 circular variance (scale to the right). (B) A threshold (1 circular variance < 0.4) applied to the map shown in (A) reveals orientation-selective voxels. Color coding represents the complex angle. (C) Polar plots showing highly orientation-selective responses in individual voxels (color coding as in B). (D) Distribution of complex angles of all orientation-selective voxels. (Data are from 23 different optical sections from 9 larvae.) Fitted bimodal von-Mises distributions reveal two populations of orientation-selective response centered at 352°(+180°) and 105°(+180°) (relative fractions of the total are 0.54 and 0.17, respectively). The baseline population represents the nontuned population of voxels responding approximately equally to all orientations (0.28). (E and F) Parametric maps of two larvae illustrating the spatial arrangement of the two populations of orientation-selective responses in the deeper portion of SFGS. White arrow indicates skin autofluorescence. (G) Preferred angles of orientation-selective responses relative to the larval body axis. Arrows are scaled to reflect relative proportion of voxels in each population. Scale bar represents 20 μm in (A), as well as in (B), (E), and (F). |
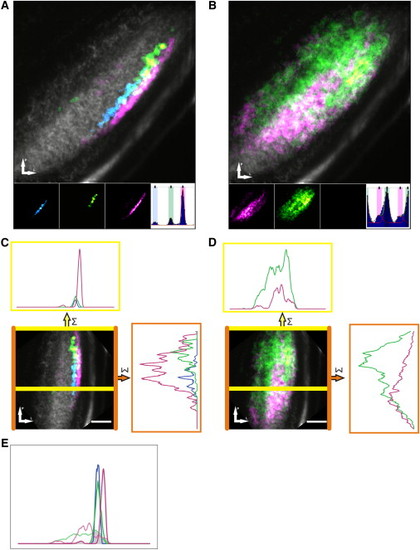
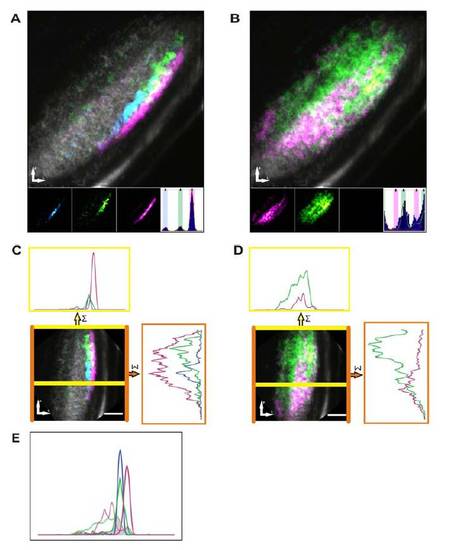
Composite Maps Reveal a Laminar and Retinotopic Organization of Direction- and Orientation-Selective Responses(A and B) Combined composite parametric maps that represent the spatial organization of responses across all subjects color coded for individual subpopulations of direction-selective (A) and orientation-selective (B) responses overlaid on an anatomical image (grayscale). Voxels that lie within ±20° of the peak of each fitted von-Mises distribution (inset histograms) are color coded and mapped on the individual (inset) and combined composite maps. (C and D) The composite maps of direction-selective (C) and orientation-selective (D) responses, respectively, are rotated to enable line plots representing the summed incidence across each axis: the area between the yellow lines represents an approximately linear segment of the neuropil to assess lamination and the area between the orange lines represents visual field to assess retinotopic organization. (E) Relative histograms of direction-selective responses and orientation-selective responses across laminar of the tectal neuropil (derived from lower line plots in C and D). Note that the area of intersection between all direction-selective (solid lines) and orientation-selective (dashed lines) voxels was only 14% of the total area—confirming the laminar segregation of direction- and orientation-selective responses. Scale bar represents 20 μm in (C) and (D). |
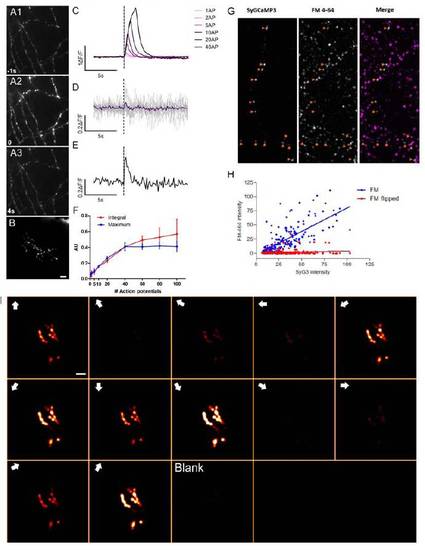
Functional characterisation of SyGCaMP3 in dissociated rat hippocampal neurons in vitro, (A1-A3) SyGCaMP3 fluorescence before (A1), during (A2) and 4s after (A3) whole-field stimulation. Note punctate distribution of SyGCaMP3 and increased fluorescence during stimulation. (B) SyGCaMP3 expression in a single RGC in vivo showing a punctuate distribution. (C) Average responses of 23 boutons measured from a single hippocampal neuron to a single action potential and trains of 2, 5, 10, 20 and 40 action potentials delivered at 20 Hz. (D) SyGCaMP3 responses to single action potentials measured in 23 single boutons from a single hippocampal neuron. Individual responses are shown in grey traces; mean response is shown in blue. (E) Example of SyGCaMP3 response to a single action potential measured in a single bouton. (F) Dynamic range of two summary metrics with the maximum %ΔF/F saturating with stimuli greater than 40 action potentials whereas the integral continues beyond this stimulus level. Thus, using the integral response post-stimulation provides a summary metric that extends the dynamic range of the calcium sensor. (G) Labelling of SyGCaMP3-transfected hippocampal cultures with FM4-64 (a marker of activity-dependent synaptic vesicle endo- and exocytosis) demonstrates that accumulations of SyGCaMP3 are sites of presynaptic vesicle release. A single SyGCaMP3 neuron is shown in the left panel, FM4-64 staining in the central panel, and a merged image is shown on the right. 96.4% of SyGCaMP3 puncta colocalise with FM4-64 staining (n=192 puncta from 2 cultures). When the SyGCaMP3 image is flipped vertically relative to the FM4- 64 image 25% of SyGCaMP3 puncta colocalise with FM4-64 label. This provides an estimate of colocalisation arising through chance due to the high density of FM4-64 staining. Our results showing the correlation between GCaMP3-reported presynaptic calcium and vesicular release confirms those of Li et al., 2012. (H) SyGCaMP3 intensity at individual puncta correlates with FM4-64 staining intensity in correctly orientated images (FM, blue data points, F1,190=198, P<0.0001) but not when the SyGCaMP3 image is flipped relative to the FM4-64 images (FM flipped, red data points F1,190=2.094, P=0.15). (I) Montage showing the response of a single RGC expressing SyGCaMP3 to each stimulus epoch. Voxels are colour-coded according to the response integral during each stimulus epoch (the response metric used to calculate orientation and direction-selectivity). Note that signal changes are confined to SyGCaMP3 puncta at all response amplitudes. Direction of motion during each stimulus epoch is shown in the top left hand corner of each panel. Responses of this cell across the entire experiment are shown in supplementary movie 3. Scale bar=5μm. |
(related to Figure 2). Direction-selective responses characterised using a direction-selective index (DSI). (A) Histogram showing the distribution of direction-selective indices (DSI) for all responsive voxels. A threshold of 0.5 was used to distinguish directionselective voxels (>0.5) from non-selective ones (<0.5, dashed line). For comparison a histogram showing the distribution of summed vectors for all responsive voxels is shown in (B), in which a threshold of 0.002 was used to distinguish direction-selective voxels (>0.002) from non-selective ones (<0.002, dashed line). (C) Voxel-wise DSI analysis of a tuning experiment from a single larva. Voxels are colour-coded according to their DSI (scale shown to the right). Orientation of the image is indicated bottom left (P=posterior, L=lateral). (D) A threshold (DSI≥0.5) applied to the map shown in (C) reveals a significant number of direction-selective voxels and that these localise to superficial regions of the tectal neuropil. Each voxel is colour-coded according to its preferred angle (scale to the right). (E) Histogram showing the distribution of preferred angles for all direction-selective voxels. (Data is from 23 different optical sections from 9 larvae). Fitting von-Mises distributions to the histogram data reveals three populations of direction selective voxels centred at 34º, 166º and 268º. (F) Map of a single larva showing the three populations of direction-selective responses centred on von-Mises distributions ±20º (see legend to the right) superimposed onto the mean fluorescence image of SyGCaMP3-expressing axons. Direction-selective responses occur in the superficial third of SFGS. White arrow indicates skin autofluorescence. (G) Voxel-wise vector sum analysis of single RGC labelled with SyGCaMP3 in vivo. Voxels are colourcoded according to summed vector angle. Histogram of data is shown in inset. Orientation of the image is shown bottom left. (H) Applying a threshold of >0.002 to the map show in (G) and colour-coding voxels according to summed vector angle (scale to the right) reveals selectivity of the cell for tail-to-head motion. Histogram of data is shown in inset, and data in polar plot form is shown in (I). Due to their relative scarcity and the stochastic nature of the mosaic expression strategy we have not yet labelled single cells selective for 30º and 164º. Scale bar=20 µm in C (also for D and F), and 2μm in G (also for H). |
(related to Figure 3). Orientation-selective responses characterised using an orientation selective index (OSI). (A) Histogram showing the distribution of orientationselective indices (OSI) for all responsive voxels. A threshold of 0.5 was used to distinguish orientation-selective voxels (>0.5) from non-selective ones (<0.5, dashed line). For comparison a histogram showing the distribution of 1-circular variance for all responsive voxels is shown in (B). A threshold of 0.4 was used to distinguish orientation-selective voxels (<0.4) from non-selective ones (>0.4, dashed line). (C) Voxel-wise analysis of OSI from a single larva. Voxels are colour-coded according to OSI (scale to the right). Orientation of the image is indicated bottom left (P=posterior, L=lateral). (D) A threshold (OSI>0.5) applied to the map shown in (C) reveals a significant number of orientation-selective voxels. Voxels are colour-coded according to preferred direction of motion (scale to the right). (E) Histogram showing the distribution of preferred motion angles of all orientation-selective voxels. NB the optimal bar orientation is orthogonal to these values. (Data is from 23 different optical sections from 9 larvae). Fitting two summed von-Mises distributions to the histogram data reveals two populations of orientation-selective voxels with population peaks centred at 105º/285º and 176º/356º (F and G) Maps of two larvae showing the two populations of orientation-selective responses centred on von-Mises distributions ±20º (see legend underneath) superimposed onto the mean fluorescence image of SyGCaMP3-expressing axons. Orientation-selective responses occur in the deeper portion of SFGS. The two maps illustrate that the organisation of orientation-selective responses is more variable from animal to animal than direction-selective responses. White arrow indicates skin autofluorescence. (H) Representative tertiary map showing the spatial segregation of direction-selective, orientation-selective and other visually responsive voxels in a single section. (I and L) Voxel-wise analysis of 1-circular variance of single RGCs labelled with SyGCaMP3 in vivo. Voxels are colour coded according to scales on the right. Histograms of data shown in insets. (J and M) Applying a threshold of <0.4 to the maps shown in (I and L) and colour coding voxels according to complex angle (scale to the right) reveals selectivity of the cell for vertical and horizontal motion respectively. Histogram of data shown in insets, and data in polar plot form are shown in (K and N). Scale bar=20 μm in C (for D,F,G,H), and 2 μm in I (for J, L and M). |
(related to Figure 4). Composite maps reveal a laminar and retinotopic organization of direction- and orientation-selective responses using DSI and OSI metrics. (A and B) Combined composite parametric maps that represent the spatial organization of responses across all subjects colour-coded for individual sub-populations of directionselective (direction-selective index – A) and orientation-selective (orientation-selective index - B) responses overlaid on an anatomical image (grey scale). Voxels that lie within ±20º of 9 the peak of each fitted von-Mises distribution (inset histograms) are colour-coded and mapped on the individual (inset) and combined composite maps. Within the individual parametric maps voxel brightness is proportional to the summed incidence of each functional response across all fish imaged. (C and D) The composite maps of direction-selective and orientation-selective responses respectively are rotated to enable line plots representing the summed incidence across each axis: between the yellow lines represents an approximately linear segment of the neuropil to assess lamination and; between orange lines represents visual field to assess retinotopic organization. (E) Relative histograms (normalising area under each curve) of direction-selective responses (dashed line) and orientation-selective responses across laminar of the tectal neuropil (derived from lower line-plots in C and D). Note the area of intersection between all direction-selective (solid lines) and orientationselective voxels (dashed lines) was only 16% of the total area - confirming the laminar segregation of direction- and orientation-selective responses. Orientation of each image is indicated bottom left (P=posterior, L=lateral). Scale bar=20μm in C and D. |