
|
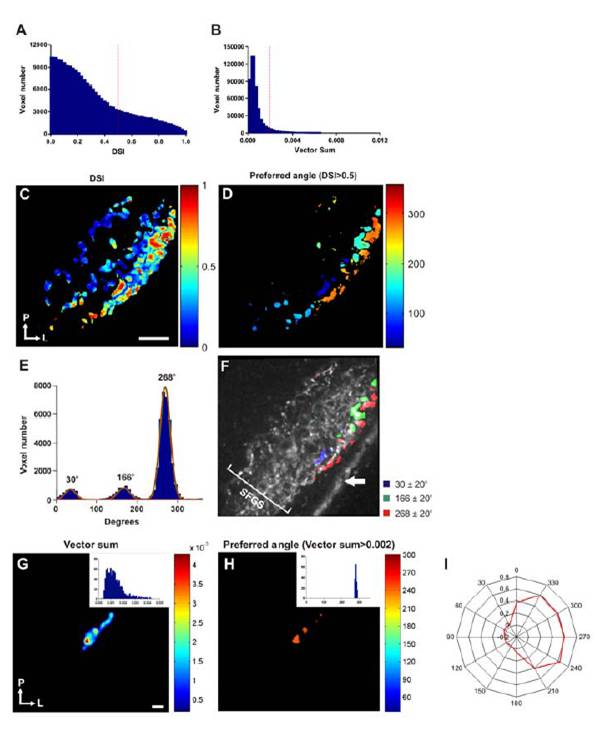
Fig. S2 (related to Figure 2). Direction-selective responses characterised using a direction-selective index (DSI). (A) Histogram showing the distribution of direction-selective indices (DSI) for all responsive voxels. A threshold of 0.5 was used to distinguish directionselective voxels (>0.5) from non-selective ones (<0.5, dashed line). For comparison a histogram showing the distribution of summed vectors for all responsive voxels is shown in (B), in which a threshold of 0.002 was used to distinguish direction-selective voxels (>0.002) from non-selective ones (<0.002, dashed line). (C) Voxel-wise DSI analysis of a tuning experiment from a single larva. Voxels are colour-coded according to their DSI (scale shown to the right). Orientation of the image is indicated bottom left (P=posterior, L=lateral). (D) A threshold (DSI≥0.5) applied to the map shown in (C) reveals a significant number of direction-selective voxels and that these localise to superficial regions of the tectal neuropil. Each voxel is colour-coded according to its preferred angle (scale to the right). (E) Histogram showing the distribution of preferred angles for all direction-selective voxels. (Data is from 23 different optical sections from 9 larvae). Fitting von-Mises distributions to the histogram data reveals three populations of direction selective voxels centred at 34º, 166º and 268º. (F) Map of a single larva showing the three populations of direction-selective responses centred on von-Mises distributions ±20º (see legend to the right) superimposed onto the mean fluorescence image of SyGCaMP3-expressing axons. Direction-selective responses occur in the superficial third of SFGS. White arrow indicates skin autofluorescence. (G) Voxel-wise vector sum analysis of single RGC labelled with SyGCaMP3 in vivo. Voxels are colourcoded according to summed vector angle. Histogram of data is shown in inset. Orientation of the image is shown bottom left. (H) Applying a threshold of >0.002 to the map show in (G) and colour-coding voxels according to summed vector angle (scale to the right) reveals selectivity of the cell for tail-to-head motion. Histogram of data is shown in inset, and data in polar plot form is shown in (I). Due to their relative scarcity and the stochastic nature of the mosaic expression strategy we have not yet labelled single cells selective for 30º and 164º. Scale bar=20 µm in C (also for D and F), and 2μm in G (also for H).