
Fig. 4
- ID
- ZDB-FIG-121116-26
- Publication
- Nikolaou et al., 2012 - Parametric functional maps of visual inputs to the tectum
- Other Figures
- All Figure Page
- Back to All Figure Page
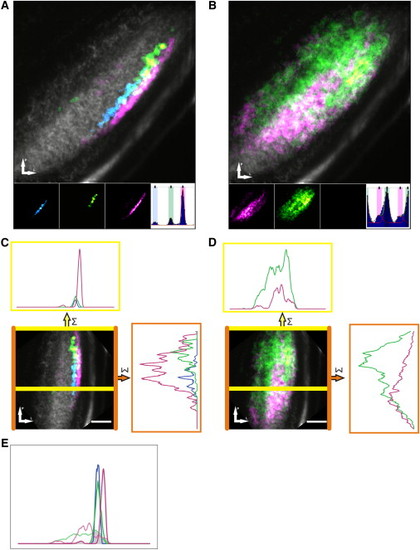
Composite Maps Reveal a Laminar and Retinotopic Organization of Direction- and Orientation-Selective Responses(A and B) Combined composite parametric maps that represent the spatial organization of responses across all subjects color coded for individual subpopulations of direction-selective (A) and orientation-selective (B) responses overlaid on an anatomical image (grayscale). Voxels that lie within ±20° of the peak of each fitted von-Mises distribution (inset histograms) are color coded and mapped on the individual (inset) and combined composite maps. (C and D) The composite maps of direction-selective (C) and orientation-selective (D) responses, respectively, are rotated to enable line plots representing the summed incidence across each axis: the area between the yellow lines represents an approximately linear segment of the neuropil to assess lamination and the area between the orange lines represents visual field to assess retinotopic organization. (E) Relative histograms of direction-selective responses and orientation-selective responses across laminar of the tectal neuropil (derived from lower line plots in C and D). Note that the area of intersection between all direction-selective (solid lines) and orientation-selective (dashed lines) voxels was only 14% of the total area—confirming the laminar segregation of direction- and orientation-selective responses. Scale bar represents 20 μm in (C) and (D). |