
Fig. 2
- ID
- ZDB-FIG-121116-24
- Publication
- Nikolaou et al., 2012 - Parametric functional maps of visual inputs to the tectum
- Other Figures
- All Figure Page
- Back to All Figure Page
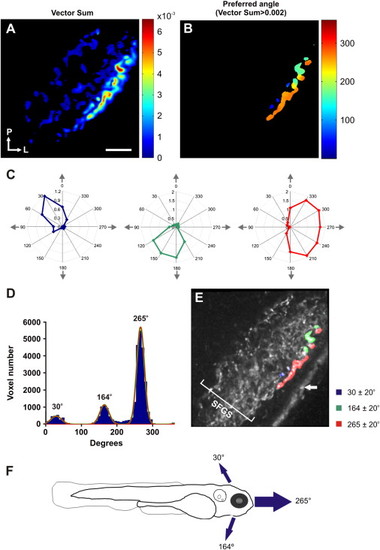
Direction-Selective Responses Are Restricted to a Superficial Layer of SFGS(A) Voxel-wise vector sum analysis of a single larva. Voxels are color coded according to vector sum (scale shown to the right). (B) A threshold (vector sum > 0.002) applied to the map shown in (A) reveals direction-selective voxels localized to superficial regions of the tectal neuropil. Color coding represents the preferred angle. (C) Polar plots of representative voxels with highly direction-selective responses (color coding as in B). (D) Distribution of vector angles for all direction-selective voxels (23 optical sections from 9 larvae). Fitted von-Mises distributions confirm three populations of direction-selective voxels centered at 30°, 164°, and 265°. (E) Parametric map of a single larva illustrating the three populations of direction-selective responses superimposed onto the mean fluorescence image of SyGCaMP3-expressing axons. Direction-selective responses occur in a superficial layer of SFGS. White arrow indicates skin autofluorescence. (F) Preferred angles of direction-selective responses relative to the larval body axis. Arrows are scaled to reflect the relative proportion of voxels in each population. Scale bar represents 20 μm in (A), as well as in (B) and (E). |