
|
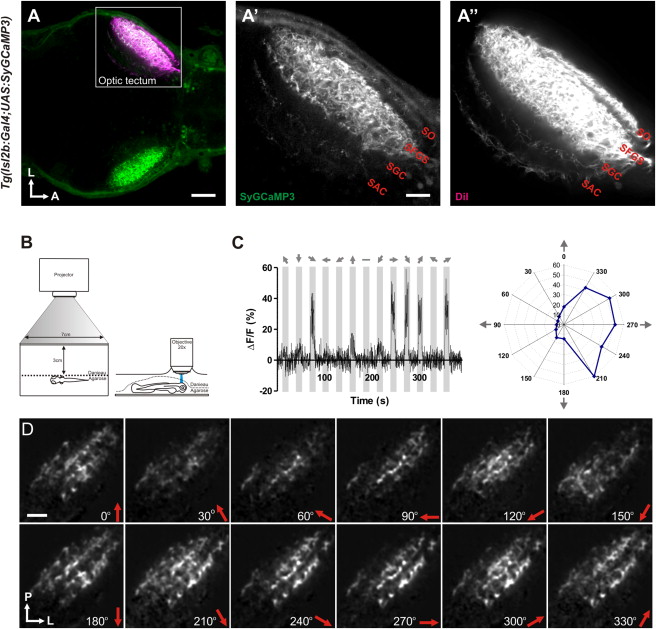
Fig. 1 SyGCaMP3 Transgenic Zebrafish and Experimental Set-Up(A–A′′) Dorsal view of a 7 dpf double transgenic Tg(Isl2b:Gal4;UAS:SyGCaMP3) zebrafish larva showing SyGCaMP3 expression in RGC axons within the tectal neuropil. DiI, injected into the right eye, labels RGC axons throughout all retinorecipient laminae in the left tectal hemisphere. Boxed region is magnified in (A′) and (A′′) (SO, stratum opticum; SFGS, stratum fibrosum et griseum superficiale; SGC, stratum griseum centrale; SAC, stratum album centrale) (L, lateral; A, anterior). (B) Larvae were immobilized in agarose and placed with one eye facing a projection screen. Visually evoked SyGCaMP3 responses were recorded in the contralateral tectum. (C) Representative percentage ΔF/F of a single voxel during a tuning experiment. Stimulus epochs are shown in gray and direction of motion is indicated by arrows. Integral responses in polar plot form are shown to the right. (D) Montage showing integral responses (grayscale) of all voxels (RGC axons) in the tectum. Direction of motion is shown on the bottom right in each panel. Orientation of the image is shown on the bottom left (P, posterior; L, lateral). Scale bars represent 50 μm in (A), 20 μm in (A′), and 20 μm in (D).