
- Title
-
Signalling from hindbrain boundaries regulates neuronal clustering that patterns neurogenesis
- Authors
- Terriente, J., Gerety, S.S., Watanabe-Asaka, T., Gonzalez-Quevedo, R., and Wilkinson, D.G.
- Source
- Full text @ Development
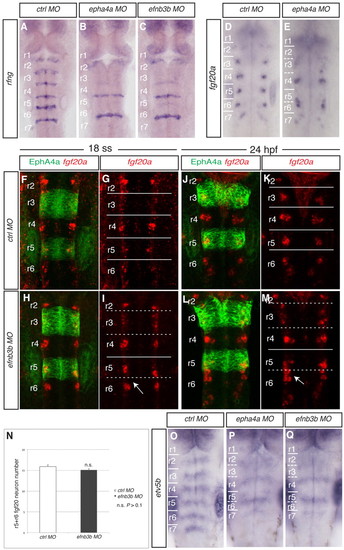
Disruption of a subset of rhombomere boundaries affects the position of fgf20a neurons. Brightfield and confocal images show dorsal views of the zebrafish hindbrain, anterior to the top, following in situ hybridisation (blue or red) and staining for EphA4 protein (green). (A-C) rfng expression in 21 ss embryos after injection of control MO (A), epha4a MO (B) or efnb3b-SB MO (C). There is decreased boundary marker expression selectively at the r2/r3, r3/r4 and r5/r6 borders following epha4a (90%, n=32) or efnb3b (82%, n=23) knockdown. (D,E) fgf20a expression at 24 hpf after injection of control MO (D) or epha4a MO (E). Knockdown of epha4a leads to altered localisation of fgf20a neurons (88%, n=26). (F-M) fgf20a expression (red) and EphA4 antibody staining (green) in embryos injected with control MO (F,G,J,K) or efnb3b-SB MO (H,I,L,M) at 18 ss (F-I) and 24 hpf (J-M). Arrow points to r5 and r6 fgf20a neuronal clusters that approach and fuse near to the r5/r6 interface. efnb3b morphants do not have the r5-r6 fusion of fgf20a neurons at 18 ss (95%, n=20), but do at 24 hpf (83%, n=18). (N) Quantitation of the number of fgf20a neurons in r5 plus r6. There is no significant difference between control versus efnb3b knockdown embryos (15.9±0.4 versus 15.1±0.3 neurons, average ± s.e.m., n=11 each; P=0.19). (O-Q) etv5b expression at 30 hpf in embryos injected with control MO (O), epha4a MO (P) and efnb3b-SB MO (Q). Knockdown of epha4a or efnb3b leads to an altered pattern with fewer stripes of etv5b expression (94%, n=35; 88%, n=24, respectively). Dashed white lines indicate the position of missing boundary marker expression, and continuous white lines indicate the position of remaining boundary cells. r, rhombomere. EXPRESSION / LABELING:
|
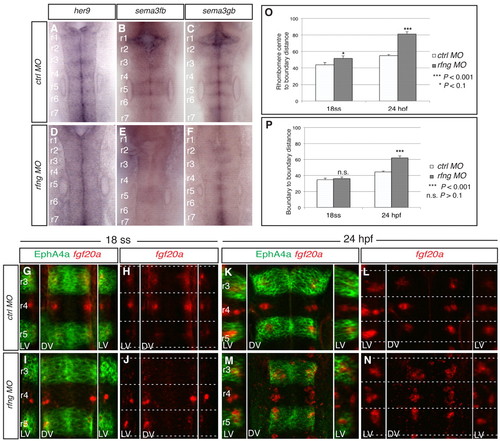
Disruption of all rhombomere boundaries leads to spreading of fgf20a neurons. (A-F) Expression of her9 (A,D), sema3fb (B,E) and sema3gb (C,F) in 24-hpf zebrafish embryos following injection of control MO (A-C) or rfng MO (D-F). rfng knockdown leads to loss of these markers at hindbrain boundaries (100%, n=14; 94%, n=16; 93%, n=15, respectively). (G-N) Expression of fgf20a mRNA (red) and EphA4a protein (green) at 18 ss (G-J) and 24 hpf (K-N) in control MO embryos (G,H,K,N) and rfng MO embryos (I,J,M,N). rfng knockdown has little effect on the organisation of fgf20a neurons at 18 ss (100%, n=8), but a strong effect at 24 hpf (90%, n=18). Dashed white lines indicate the position of segment borders. Left and right reconstructed lateral views (LV) and dorsal views (DV) are shown. (O) The average distance from fgf20 neuronal cluster edge to boundary. y-axis represents the distance from the rhombomere centre (0) to the boundary (100 arbitrary units, A.U.). For control MO the average distance from centre to cluster edge at 18 ss is 43.8±2.8 A.U. (n=15) and at 24 hpf is 54.9±1.5 A.U. (n=48). For rfng MO the distance at 18 ss is 51.8±2.8 A.U. (n=30; P=0.09) and at 24 hpf is 81.2±2.6 A.U. (n=48; P=9.4×10⁻¹⁶). On average, clusters in rfng morphants are 18% closer to boundaries than in controls at 18 ss, which increases significantly to a difference of 48% by 24 hpf. (P) Average anteroposterior (AP) length of fgf20 neuronal clusters. y-axis represents the distance from one rhombomere boundary (0) to another boundary (100 A.U.). For control MO at 18 ss the distance is 34.8±1.9 A.U. (n=15) and at 24 hpf is 44.6±0.9 A.U. (n=48). For rfng MO embryos the average length at 18 ss is 36.1±1.9 A.U. (n=30; P=0.67) and at 24 hpf is 62.1±2.4 A.U. (n=29; P=4.4×10⁻⁷). At 18 ss the difference is not significant, whereas at 24 hpf there is a significant 39% increase in length compared with control embryos. Values are average ± s.e.m. The orientation of embryos is as in Fig. 1. EXPRESSION / LABELING:
|
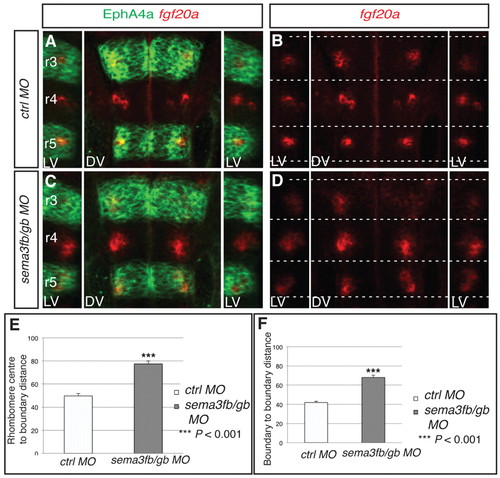
Sema3fb and Sema3gb position fgf20a neurons. (A-D) fgf20a expression (red) combined with EphA4 antibody staining (green) at 24 hpf in zebrafish embryos injected with control MO (A,B) or sema3fb+sema3gb MO (C,D). Dashed white lines indicate the position of boundary marker expression. Left and right reconstructed lateral views (LV) plus dorsal views (DV) are shown. Knockdown of sema3fb+sema3gb disrupts the organisation of fgf20a neurons (79%, n=24). (E,F) The average distance from fgf20a neuronal clusters to boundary (E) and average AP length of clusters (F); see Fig. 2 legend for methodology. In control MO embryos, the average distance to the boundary is 49.7±2.1 A.U. (n=24); in sema3fb+sema3gb MO embryos this increases to 77.4±2.8 A.U. (n=24; P=2.2×10⁻⁸), resulting in sema3fb+sema3gb clusters being on average half the distance from boundaries than control clusters. In control MO embryos the average cluster length is 41.8±1.4. A.U. (n=24), which increases in sema3fb+sema3gb MO embryos to 68.0±2.3 A.U. (n=24; P=3.0×10⁻⁹), a 62% increase in length. Values are average ± s.e.m. The orientation of embryos is as in Fig. 1. EXPRESSION / LABELING:
|

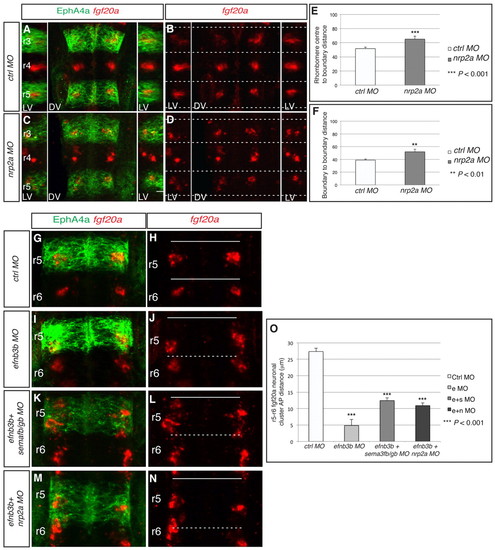
Nrp2a is required to position fgf20a neuronal clusters. (A-D) fgf20a expression (red) combined with EphA4 antibody staining (green) at 24 hpf in zebrafish embryos injected with (A,B) control MO or (C,D) nrp2a MO. Dashed white lines indicate the position of segment borders. Left and right reconstructed lateral views (LV) plus dorsal views (DV). nrp2a knockdown disrupts the organisation of fgf20a neurons (70%, n=17). (E,F) The average distance from fgf20 neuronal clusters to boundary (E) and average AP length of clusters (F). In control MO embryos, the average distance to the boundary is 51.6±2.2 A.U. (n=24), which in nrp2a MO embryos increases to 65.1±4.1 A.U. (n=24; P=5×10⁻⁴), i.e. 22% closer to boundaries. In control MO embryos the average cluster length is 38.8±1.6 A.U. and this increases in nrp2a morphants to 52.0±4.0 A.U. (n=24; P=4×10⁻³), a 34% increase in length. (G-N) fgf20a mRNA expression (red) and EphA4 antibody staining (green) of embryos injected with control MO (G,H), efnb3b MO (I,J), efnb3b+sema3fb+sema3gb MOs (K,L) or efnb3b+nrp2a MOs (M,N). Dashed white lines indicate the position of depleted boundary cells; continuous white lines indicate the position of the remaining boundaries. The migration of fgf20a neurons towards the r5/r6 interface following efnb3b knockdown was partly blocked when combined with sema3fb+sema3gb knockdown (76%, n=17) or nrp2a knockdown (70%, n=23). (O) Quantitation of the distance between r5 and r6 fgf20a neuronal clusters in the different knockdown experiments. There is a significant decrease in the distance between both clusters in efnB3b morphants (e MO), as compared with control MO, that is significantly rescued by co-injection of sema3fb+sema3gb MOs (e+s MO) or nrp2a MO (e+n MO): control MO 27.3±1.0 μm (n=10) versus efnb3b MO 4.9±1.6 μm (n=10), P=3.1×10⁻⁹; e+s MO 12.4±0.8 μm (n=10), P=9.5×10⁻¹⁰; e+n MO 10.9±0.8 μm (n=10), P=2.0×10⁻¹⁰. Values are average ± s.e.m. EXPRESSION / LABELING:
|
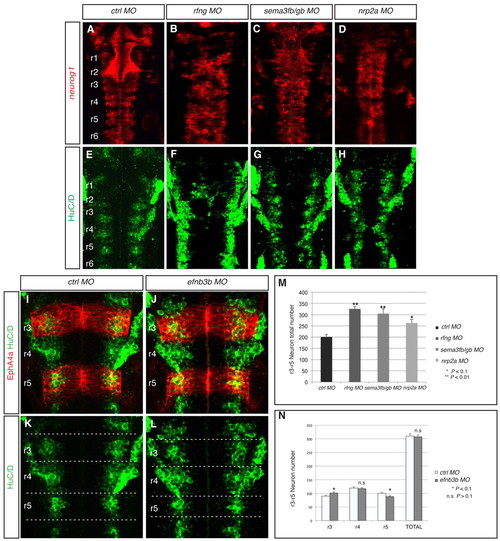
Mispositioning of fgf20a neurons affects the patterning and amount of neurogenesis. (A-H,M) Expression at 30 hpf of neurog1, which marks differentiating neurons in the neural epithelium (red), and HuC/D, which marks neurons in the mantle zone (green), in embryos injected with control MO (A,E), rfng MO (B,F), sema3fb+sema3gb MOs (C,G) or nrp2a MO (D,H). Knockdown of rfng (85%, n=14), sema3fb+sema3gb (65%, n=23) or nrp2a (59%, n=17) leads to disorganisation of the neurogenic zones. (M) Quantitation of the number of HuC/D-expressing cells in r3 to r5 in control MO embryos (201±9.7 neurons, n=4) reveals that these increase following knockdown of rfng (326±16.2 neurons, n=4; P=0.008), sema3fb+sema3gb (306±9.4 neurons, n=4; P=0.001) or nrp2a (263±9.4 neurons, n=4; P=0.06). (I-L,N) HuC/D-expressing neurons (green) combined with EphA4 antibody staining (red) at 30 hpf in control (L,K) and efnb3b (J,L) knockdown embryos. (N) Quantitation of neurons in both conditions in r3, r4 and r5 separately plus total number. There is a significant increase in the number of neurons in r3 (control MO 90±2.7, n=5, versus efnb3b MO 101±3.1; P=0.09), a decrease in r5 (control MO 100±2.7, n=5, versus efnb3b MO 88±3.5; P=0.06), but no significant change in r4 (control MO 120±4.6, n=5, versus efnb3b 118±3.3; P=0.74). The total number of neurons is not significantly different (control MO 310±9.1, n=5, versus efnb3b 307±7.2; P=0.85). The orientation of embryos is as in Fig. 1. |
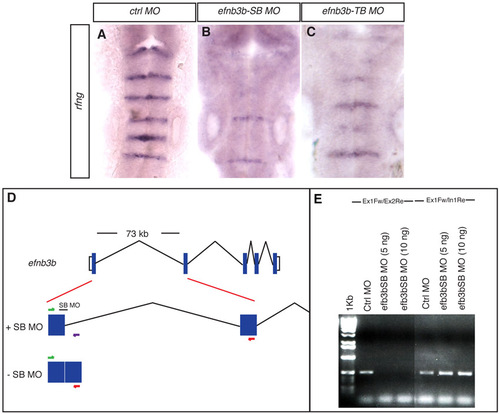
Validation of ephrin B3b MO knockdown. (A-C) rfng expression at 21 ss after injection of control MO (A), efnb3b-SB MO (B) or efnb3b-TB MO (C). There is a loss of boundary marker expression selectively at the r2/r3, r3/r4 and r5/r6 borders following injection of efnb3b-SB (82%, n=23) or of efnb3b-TB (82%, n=17). (D) The efnb3b gene and the different RNA products obtained following injection of control MO or efnb3b-SB MO. (E) Agarose gel electrophoresis of Ex1Fw-Ex2Re (left side) and Ex1Fw-In1Re (right side) RT-PCR products for embryos injected with Ctrl MO, efnb3b-SB (5 ng) and efnb3b-SB (10 ng). The exon 1-exon 2 RT-PCR product seen in control MO embryos is absent when injected with either concentration of efnb3b-SB (the 73 kb intron 1 is too large to amplify) and there is a concurrent increase in the amount of exon 1-intron 1 RT-PCR product. |
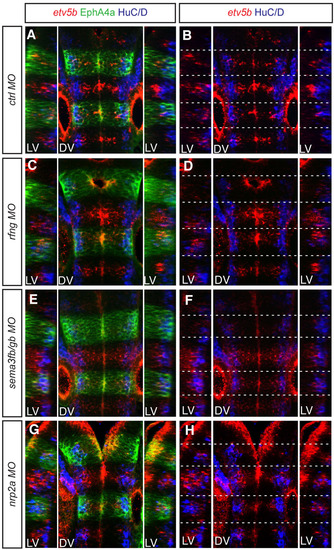
etv5b expression in rfng, sema3fb/gb and nrp2a morphants. Confocal images of dorsal views of the 30-hpf zebrafish hindbrain, anterior to the top, for (A,B) control MO, (C,D) rfng MO, (E,F) sema3fb+sema3gb MOs and (G,H) nrp2a MO. Dashed white lines indicate the position of segment borders. Left and right reconstructed lateral views (LV) plus dorsal views (DV) of etv5b whole-mount mRNA fluorescent in situ hybridisation (red), combined with HuC/D (blue) and EphA4 antibody staining (green). etv5b expression is less restricted to segment centres and/or is at lower levels in all the knockdown conditions compared with the control situation. Orientation of embryos as Fig. 1. |
Strategy to measure the distribution of fgf20a neurons following different gene knockdowns. (A) Scheme of the procedure to collect images and measure the average distance from fgf20a neuronal clusters to boundaries compared with the rhombomere centre-to-boundary distance (α), and the average fgf20a neuronal cluster length compared with the boundary-to-boundary length (β). (B-E) Examples of confocal images of fgf20a-expressing cells in 24-hpf zebrafish hindbrain, anterior to the top. All images are fitted to the same area, with its longitudinal side going from one hindbrain boundary at the bottom to another at the top (visualised by Epha4a expression, not shown). (B) Control MO; (C) rfng MO; (D) sema3fb+sema3gb MOs; (E) nrp2a MO. |
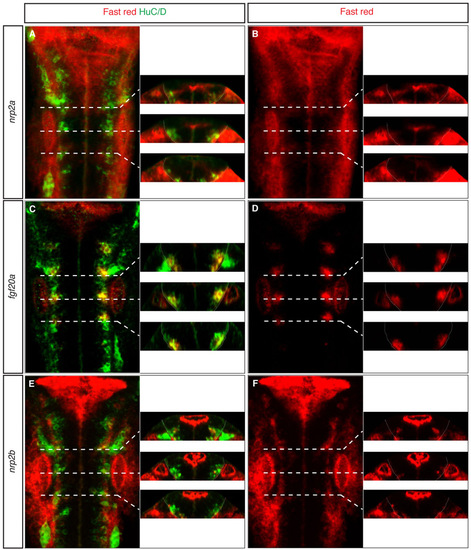
fgf20a and nrp2a expression colocalise. Expression pattern of (A,B) nrp2a, (C,D) fgf20a and (E,F) nrp2b. Left side of each panel shows confocal images of dorsal views of 24-hpf zebrafish hindbrain, anterior to the top. Right side shows z-reconstruction at AP positions marked by white dashed lines of the same embryo. White line delimits the neural tube position. The fluorescent in situ hybridisation signal was generated by Fast Red staining (red) and combined with Hu antibody staining (green). This approach was taken because the signals were too weak to achieve double in situ hybridisation staining. Orientation of embryos as Fig. 1. |