
- Title
-
Biphasic wnt8a expression is achieved through interactions of multiple regulatory inputs
- Authors
- Narayanan, A., and Lekven, A.C.
- Source
- Full text @ Dev. Dyn.
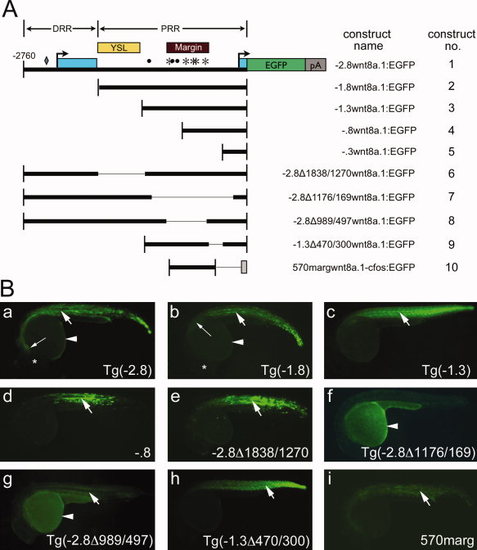
Dissection of wnt8a cis-regulatory regions. A: Schematic diagram of reporter constructs used in this study, drawn to scale. Construct 1 (-2.8wnt8a.1:EGFP) contains the fragment extending 2,760 bp upstream of the wnt8a.1 translation initiation codon (-2,760). Salient functional features are indicated on construct 1. Light blue boxes, exons; arrows, transcription start sites. The diamond, asterisks, and dots indicate Zbtb4, FoxH1, and Ntl consensus binding sequences, respectively. Yellow box, YSL enhancer; maroon box, margin enhancer; DRR, distal regulatory region; PRR, proximal regulatory region. Thick bars indicate the regulatory region included in each construct. Thin lines indicate deleted regions. The grey box in construct 10 indicates the c-fos minimal promoter. B: EGFP reporter expression in stable or transient assays at 24 hpf. All images: lateral views, anterior to left. Reporter construct is indicated in lower right. a,b,c,f,g,h: Stable transgenic embryos. d,e,i: Transient expression assays. Arrows, somitic expression; arrowheads, YSL expression. Note that YSL fluorescence in stable lines is dimmer than that observed in transient assays, likely owing to stable integration of single-copy transposons. At 24 hpf, YSL fluorescence in stable lines is observed as an outline of the yolk that is slightly brighter than yolk autofluorescence. a,b: Long arrows, anterior limit of reporter fluorescence; asterisks, position of the eye. |
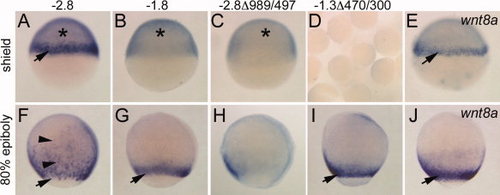
Phase I and Phase II wnt8a reporter expression. All images are in situ hybridizations for EGFP transcripts in embryos from stable transgenic lines, except E, J, which show wnt8a expression in wild-type. Lateral view, dorsal right. A–E: Shield stage. F–J: Eighty percent epiboly. Reporter transgene is indicated above each row. Arrows, expression in the margin; asterisks, YSL expression, which at this stage manifests as a general blue stain underneath the epiblast layer of the embryo. YSL staining was confirmed by YSL fluorescence observed in live embryos. Representative group of embryos is shown in D. Arrowheads in F indicate scattered ingressing cells. Note qualitative difference between pattern in F from that in G and I and the wnt8a pattern in J. |
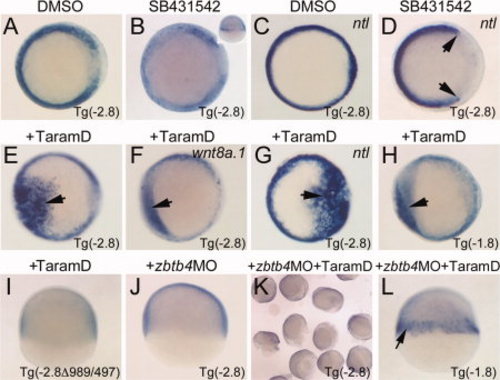
Phase I expression requires a Nodal response by the margin enhancer and Zbtb4. A,B: In situ hybridizations for EGFP transcripts in shield stage Tg(-2.8) embryos, animal pole views, dorsal right. A: Control DMSO-treated embryo. B: SB431542-treated embryo. Note significant reduction in transcripts. Inset: Lateral view to show patchy expression in the margin. C,D: In situ hybridizations for ntla transcripts to confirm Nodal loss of function. C: Control DMSO-treated embryo. D: SB431542-treated embryo. Note loss of dorsal mesoderm indicative of strong reduction in Nodal signaling (arrows). E–I: In situ hybridizations on embryos injected with Taram-D mRNA at the 1-cell stage. E: EGFP transcripts in injected Tg(-2.8) embryo. Arrow indicates ectopic EGFP reporter expression. F: wnt8a.1 expression in injected Tg(-2.8) embryo. Note induction of ectopic expression, though not as robust as the transgene. G: ntla expression in injected Tg(-2.8) embryo. Note strong induction of ntla, arrow. H: EGFP expression in injected Tg(-1.8) embryo. Note ectopic expression, arrow. I: EGFP expression in injected embryo. Note absence of a reporter response to Taram-D when margin enhancer is deleted. J–L: Zbtb4 is required for Nodal-dependent phase I expression. EGFP in situ hybridizations. J: Embryo injected with Zbtb4 morpholino. Note absence of reporter expression in the margin. K: Embryos injected with Zbtb4 morpholino and Taram-D mRNA. Note absence of reporter expression. L: Embryo injected with Zbtb4 morpholino and Taram-D mRNA. Note that the Tg(-1.8) reporter lacks the DRR, and that reporter expression is activated prematurely (arrow, compare to Fig. 3B). |
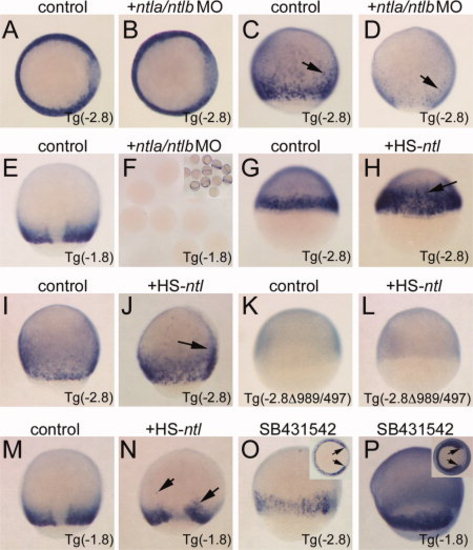
Phase II expression requires Ntl stimulation of the margin enhancer. All images are in situ hybridizations for EGFP transcripts. Embryo genotypes are indicated in the lower right corner. Treatment is indicated above each panel. A,B: Shield stage, animal pole view, dorsal right. Note expression is unchanged in B compared to control. C,D: Eighty percent epiboly stage, lateral views, dorsal right. Note absence of expression in the margin in D; only scattered staining cells are observed (arrows). E,F: Eighty percent epiboly, dorsal view, anterior up. No staining is observed in MO-injected embryos bearing the PRR-only reporter (F; inset shows sibling uninjected embryos). G,H: Shield stage, lateral views, dorsal right. Ectopic ntla is sufficient to induce the Tg(-2.8) reporter at an early stage (H, arrow). I,J: Eighty percent epiboly, lateral view, dorsal right. Ectopic ntla is sufficient to induce the Tg(-2.8) reporter in the late gastrula (J, arrow). K,L: Shield stage, lateral view, dorsal right. Ectopic ntla cannot activate the reporter lacking the margin enhancer (L). M,N: Eighty percent epiboly, dorsal view, anterior up. Ectopic ntla can weakly activate PRR-only reporters in the late gastrula (N, arrows). O,P: Eighty percent epiboly, lateral views, dorsal right. Insets: vegetal views; arrows indicate expanded dorsal clearing indicative of Nodal inhibition. Tg(-2.8) embryos show phase II reporter expression (O), and PRR-only reporters are not inhibited by Nodal antagonism (P). |
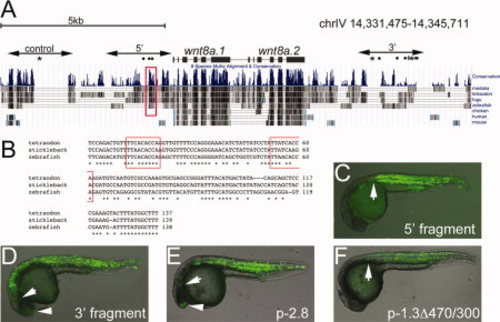
Identification of stickleback wnt8a mesoderm enhancers. A: Schematic diagram of stickleback chromosome IV spanning the wnt8a locus with the conservation tracks from the UCSC genome browser shown. The positions of the wnt8a.1 and wnt8a.2 coding regions are indicated. Control, 52, and 32 indicate the fragments tested in zebrafish transient expression assays. Dots, asterisks, and the diamond symbol above the conservation tracks indicate Ntl, FoxH1, and Zbtb4 consensus binding sequences, respectively. The red box outlines the conserved element within the margin enhancer, shown in B. B: Alignment of the conserved element. Consensus Ntl binding sequences are boxed in red. C–F: Transient expression assays in zebrafish, 24-hpf embryos, lateral view, anterior left. C: Expression from the stickleback 52 fragment extends anteriorly as far as the posterior hindbrain (arrow). Compare to the anterior limit of expression from the zebrafish -1.3Δ470/300 construct (PRR-only construct) shown in F. D: Expression from the stickleback 32 fragment extends anteriorly as far as the position of the midbrain (arrow) and some expression is observed in the telencephalon (arrowhead). Compare to transient expression from the p-2.8wnt8a.1:EGFP construct (E). |