
- Title
-
Aberrant hedgehog ligands induce progressive pancreatic fibrosis by paracrine activation of myofibroblasts and ductular cells in transgenic zebrafish
- Authors
- Jung, I.H., Jung, D.E., Park, Y.N., Song, S.Y., and Park, S.W.
- Source
- Full text @ PLoS One
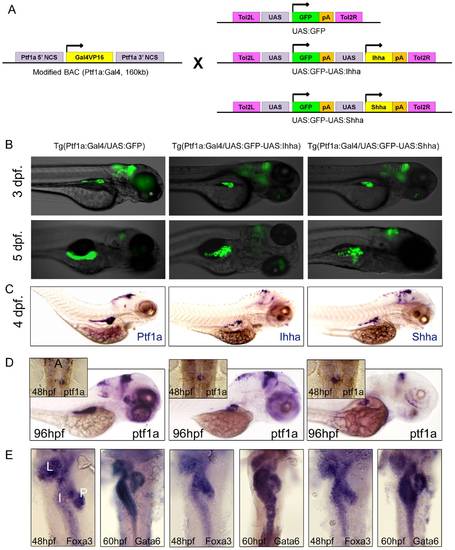
Short-term phenotypes. (A) Transgenesis strategy. (B, C) Inverted fluorescence and transgene ISH images show mosaic pattern of transgene expression in Hh ligand-expressing embryos. (D) Whole mount ISH for ptf1a at 48 and 96 hpf. Inlet figures are dorsal views with anterior to the top. A, anterior. Hh over-expression did not impair migration of ptf1a-expressing exocrine progenitor cells, showing ptf1a positive exocrine cells surrounding principal islet at 48 hpf. (E) Whole mount ISH for Foxa3 and Gata6, endodermal markers during development. Dorsal views with anterior to the top. The FoxA3 and Gata6 are properly expressed in the liver, intestine, and exocrine pancreas, and the endodermal morphologies are not affected by Hh over-expression. L, Liver; I, Intestine; P, Exocrine pancreas. |
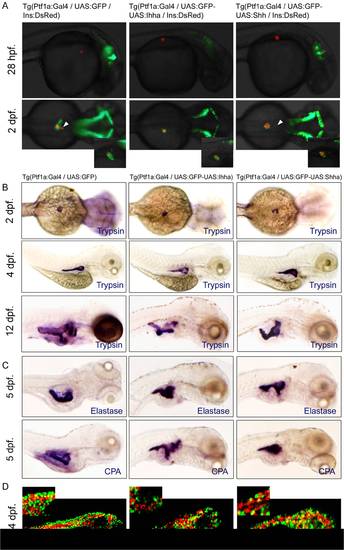
Unaffected endocrine and exocrine differentiation by Hh over-expression. (A) Fluorescence images showing the endocrine (RFP) and exocrine pancreas (GFP). When each transgenic fish is crossed with Ins-DsRed zebrafish, the development of insulin-expressing endocrine pancreas is not impaired by Hh over-expression. A smaller dot-like insulin-positive structure (white arrowheads) which corresponds to the anterior endocrine cells is observed in approximately half of the control and Hh-expressing embryos. (B, C) Whole mount ISH for trypsin, elastase, and carboxypeptidase A (CPA) at different time points. Over-expression of Hh ligands does not compromise the exocrine differentiation of the zebrafish pancreas, as evidenced by the proper and timely expression of trypsin. Expression of the other exocrine markers is also unaffected by Hh over-expression. Hh over-expression, however, induces subtle morphologic changes of the exocrine pancreas, showing a short, slender, and tortuous posterior pancreas compared to those of controls, which is evident by ISH for exocrine markers at 4 and 5 dpf and exaggerated at 12 dpf. (D) Confocal images of immunofluorescence staining for CPA. Regardless of transgene (GFP) expression, most acinar cells express CPA, suggesting unaffected exocrine differentiation by Hh over-expression. Lat., lateral. |
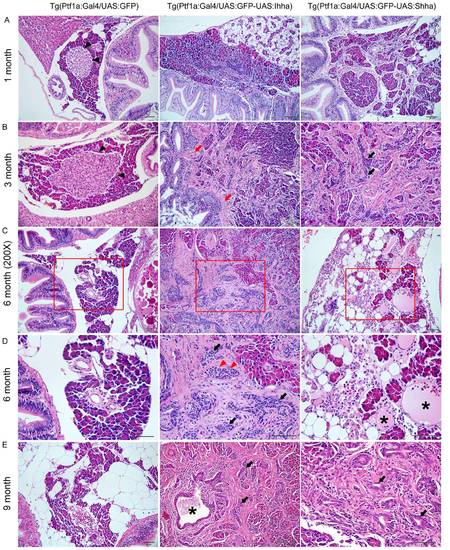
Histopathologic findings showing progressive pancreatic fibrosis. (A) Progressive pancreatic fibrosis starts at as early as 1-month old in Hh-expressing transgenic zebrafish. In non-fibrotic area, Individual morphology of the pancreatic acini and acinar cells is not unusual. (B) A principal islet is seen in control, which is well-circumscribed by acinar cells (black arrowheads). In Hh-secreting lines, accumulation of fibrosis results in the destruction of the morphologic architecture, which is prominent even at 3 months. Fibrotic bands are contiguous from the bowel wall forming adhesion between the bowel and the pancreas (red arrows), suggesting recruitment of myofibroblasts from the muscle layer of the bowel. Along with fibrosis, an increasing number of ductular structure appears within fibrotic area at 3 months of age (black arrows). (C, D) The pancreas at 6-months old. (D) An enlarged view of the red box in (C). Contrary to the islet of control in B, some islets of the Hh-expressing pancreas are completely encircled by fibrosis (red arrowheads), which is typical finding in chronic pancreatitis of human. The number of ductular structure further increased (black arrows). Occasionally, acute pancreatitis-like changes are noted, showing the infiltration of inflammatory cells and cystic space filled with mucinous material (asterisks). (E) The exocrine pancreas of 9 month-old zebrafish shows more accumulation of fibrosis and ductular structures (black arrows). At center image, a large pancreatic duct (asterisk) is seen, being surrounded by fibrosis and ductular structures. If not specified, microscopic images are 400×.Bars, 50 μm. |
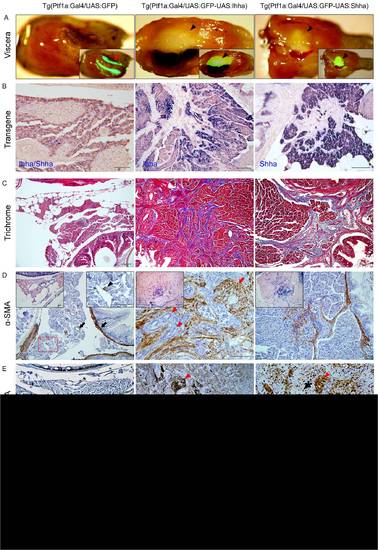
Hh-induced pancreatic fibrosis and proliferation of myofibroblasts. (A) Dissected whole viscera from 4 month-old zebrafish showing transgene (GFP) expression. Ventral views. Left, anterior. The pancreas of control appears as a thread-like structure between the bowel and visceral organs (arrow). In Hh ligand-expressing pancreas, prominent fibrosis around the principal islets forms whitish plaque-like lesions showing robust GFP expression (arrowheads). Inlets are merged in bright and fluorescence images. (B) ISH for transgene expression. The control pancreas reveals negligible expression of either Ihha or Shha. In the Hh-expressing pancreas, transgene expression is strictly restricted to acinar cells with nil expression at myofibroblasts or ductular cells. (C) Trichrome stains showing fibrotic bands. (D) IHC for α-SMA. Muscle layers of the bowel and large pancreatic ductal wall are reactive to α-SMA in control (black arrows). Infreqeuently, α-SMA-positive cells are noted (black arrowhead) in the parenchyme of control pancreas suggesting presence of stellate cells. Infilitrating myofibroblasts are invariably reactive to α-SMA while proliferating ductular cell are not (red arrowheads). Note the thickened and α-SMA-reactive intrapancreatic duct wall (red arrow). Left inlets (200×) are ISH images. Right inlet is an enlarged view of the box. (E, F) IHC for PCNA and pHH3. Within the fibrotic area, both ductular cells (red arrowheads) and myofibroblasts (black arrowheads) are frequently reactive to both PCNA and pHH3, suggesting enhanced proliferation. Intestinal crypt cells are also frequently reactive to both PCNA and pHH3 (black arrows) and used as internal control. If not specified, microscopic images are 400×. Bars, 50 μm. |
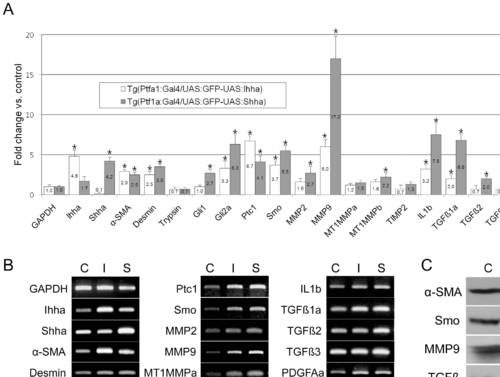
RT-PCR and Western blot. Pancreas from 3–4 month-old zebrafish was dissected under a fluorescence microscope. C, Tg(Ptf1a-Gal4/UAS:GFP); I, Tg(Ptf1a-Gal4/UAS:GFP-UAS:Ihha); S, Tg(Ptf1a-Gal4/UAS:GFP-UAS:Ihha). (A) Real-time RT-PCR showing differential expression of the components of the Hh pathway and fibrosis by Hh over-expression. Note the prominent up-regulation of MMP9 and TGFβ1a. (B) Electrophoretic images of RT-PCR products recapitulate real-time PCR data. (C) A western blot hybridization using available antibodies which are reactive to zebrafish antigens also recapitulates RT-PCR findings. α-SMA, 42 kD; Smo, 85 kD; MMP9, 75 kD; TGFß, 45 kD; β-actin, 45 kD. * P<0.05 versus control. |
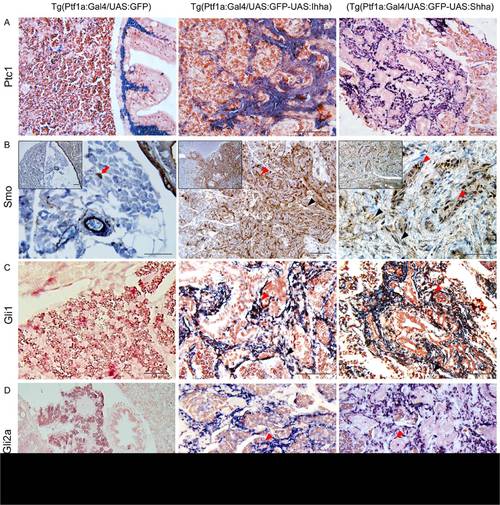
Expression of the downstream components of Hh signaling at 6 month-old zebrafish pancreas. (A) ISH for Ptc1. In control Ptc1 is expressed in the muscle layer of bowel and pancreatic duct. In the Hh-expressing pancreas, both proliferating myofibroblasts and ductular cells express Ptc1. (B) IHC for Smo reveals strong expression in a wide area of fibrosis. Both myofibroblasts and ductular cells are reactive to Smo. Likely to α-SMA immunostaining, Smo-reactive cells (red arrow) are occasionally noted in the parenchyma of the control pancreas. Inlets are 200× images. (C, D) ISH for Gli1 and Gli2a. Whereas, the control pancreas reveals a negligible degree of Gli1 and Gli2a expression, activated myofibroblasts and ductular cells express Gli1 and Gli2a. (B–D)Black arrowheads, myofibroblasts; Red arrowheads, ductular cells. If not specified, microscopic images are 400×. Bars, 50 μm. |
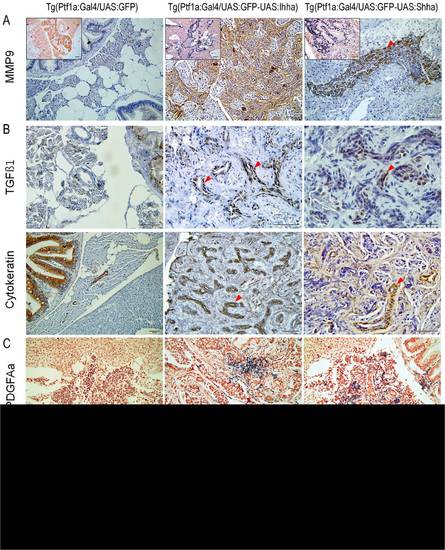
Expression of genes involved in fibrosis at 6 months. (A) IHC and ISH (inlets) showing MMP9 expression in proliferating myofibroblasts and ductular cells. (B) IHC for TGFβ1. Contrary to MMP9, TGFβ1 is expressed only in proliferating ductular cells which are also positive for cytokeratin. (C, D) ISH for PDGFAa and IL1b. Transcripts of both genes are detected in a small subset of proliferating myofibroblasts and ductular cells. (A–C, red arrowheads, ductular cells). Microscopic images are 400×. Bars, 50 μm. |
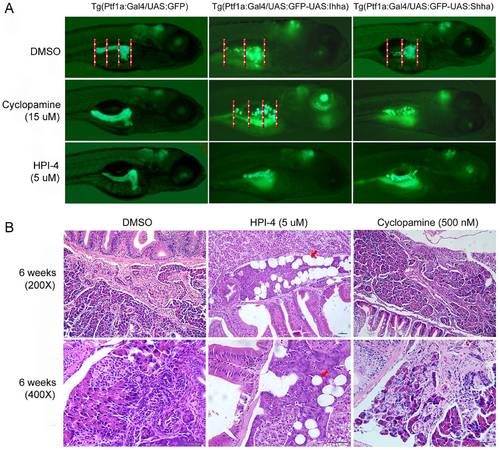
Phenotypic reversal by Hh inhibitors. (A) Reversal of pancreatic phenotypes in embryos. Embryos were treated with either HPI-4 or cyclopamine from 32 hpf until 5 dpf. Neither HPI-4 nor cyclopamine at the indicated concentrations impairs pancreatic development in controls. A well-formed pancreas in control produces a 1.5 to 2.0 times longer posterior pancreas compared to the head. Hh-expression induces a short and slender posterior pancreas showing the ratio between the body and head by approximately 1.0. By the criterion for reversal of the 1.5 times or longer posterior pancreas, the Hh-induced pancreatic phenotypes are effectively reversed by either HPI-4 or cyclopamine treatment. (B). Prevention of pancreatic fibrosis by a long-term treatment with Hh inhibitors. 12 day-old Ihha-expressing larvae were treated with Hh inhibitors for up to 6 weeks. In the HPI-4 treated group (12 out of 16 survived), there is no evidence of pancreatic fibrosis but a somewhat prominent fatty infiltration (red arrows). Contrary to HPI-4, cyclopamine failed to inhibit pancreatic fibrosis in the surviving 11 zebrafish out of 14. Bars, 50 μm. |