
- Title
-
swap70 Promotes neural precursor cell cycle exit and oligodendrocyte formation
- Authors
- Takada, N., and Appel, B.
- Source
- Full text @ Mol. Cell Neurosci.
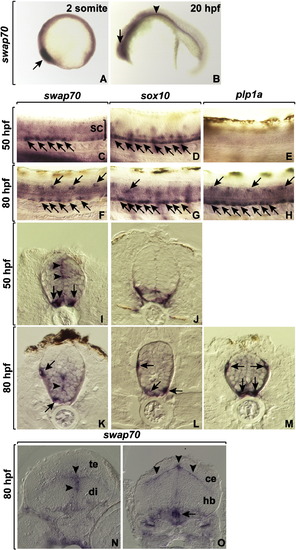
Developmental expression of swap70. (A,B) Lateral views of embryos hybridized with swap70 antisense RNA probe at 2 somite (11 hpf) and 20 hpf. The eye primordia (arrows) and pronephric ducts (arrowhead) express swap70. (C–H) Lateral views of whole embryos focused on the trunk spinal cord, with dorsal up. The bracket marks spinal cord (sc). Expression of swap70 (C,F) is similar to that of sox10 (D,G), a marker of OPCs (arrows) at 50 and 80 hpf. By contrast, expression of plp1a, which marks differentiating oligodendrocytes, is not evident until 80 hpf (E,H). (I–M) Transverse sections through trunk spinal cord, dorsal up. swap70 (I,K) is expressed similarly to sox10 (J,L) in OPCs (arrows) except that cells that line the proliferative ventricular zone (arrowheads) also express swap70 but not sox10. (M) plp1a expression marking oligodendrocytes (arrows). (N,O) Transverse sections through forebrain (N) and hindbrain (O). swap70 expression is evident at ventricular zones of the tectum (te), diencephelon (di) and at the boundary between cerebellum (ce) and hindbrain (hb). EXPRESSION / LABELING:
|
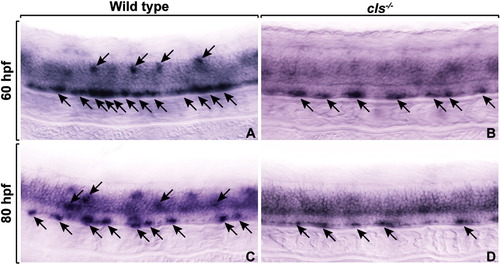
OPCs express swap70 independently of sox10 function. Lateral views of the spinal cords of wild-type (A, C) and cls-/- (B, D) embryos at 60 hpf (A, B) and 80 hpf (C, D). Arrows mark sox10 expression. Whereas fewer cells express swap70 in cls-/- embryos the level of expression appears to be similar in wild type and cls-/-. EXPRESSION / LABELING:
|
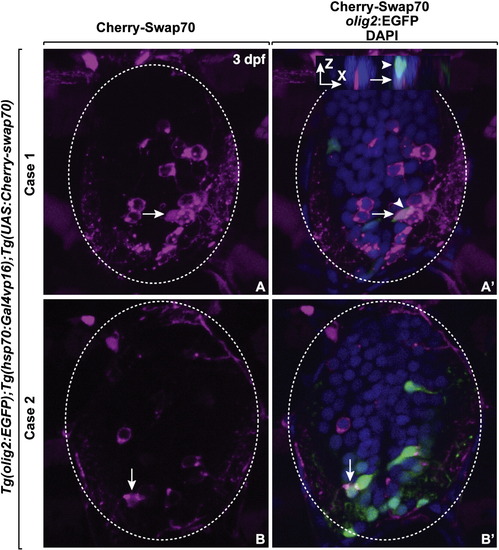
Swap70 is localized to nuclear and cytoplasmic compartments. Cherry-Swap70 was transiently expressed by crossing Tg(hsp70l:Gal4vp16);Tg(olig2:EGFP) fish to Tg(UAS:Cherry-Swap70) and performing heat shock induction. Two examples (A, A2 and B, B2) showing nuclear localization of Cherry-Swap70. (A, A2) Z-stack images were merged in single plane. An olig2-EGFP- cell (arrow) next to olig2-EGFP+ cell (arrowhead) in anterior–posterior position had nuclear localized Cherry-Swap70. The inset is an X-Z projection of the image. (B, B2) Single plane image showing nuclear localization of Cherry-Swap70 in an olig2:EGFP+ precursor cell (arrow). Nuclei are labeled with DAPI (blue). EXPRESSION / LABELING:
|
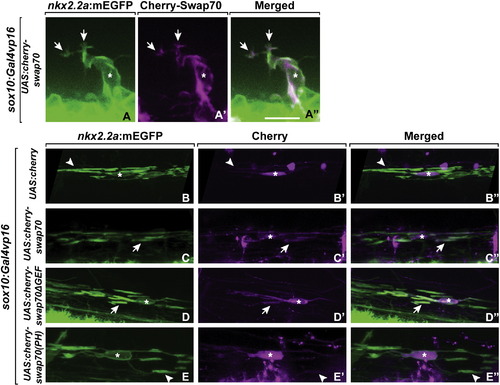
Swap70 localization in migrating OPCs and myelinating oligodendrocytes. Cherry-Swap70 was transiently expressed in OPCs by co-injecting sox10:Gal4vp16 plasmid and the following plasmids: UAS:Cherry-Swap70 (A–A3, C–C3), UAS-Cherry (B–B3), UAS-Cherry-Swap70ΔGEF (D–D3), UAS-Cherry-Swap70(PH) (E–E3). (A–A3) Cherry-Swap70 was localized at the tips of membrane processes (arrows) and the cell membrane of migrating OPCs. (B–B3) In myelinating oligodendrocytes, Cherry localized to the cytoplasm (asterisks) but not to internode membrane (arrowheads). (C–C3) Cherry-Swap70 was localized to membrane (asterisks) and the axon-wrapping internodes (arrows). (D–D2) C-terminal deleted Swap70 fused to Cherry (Cherry-Swap70ΔGEF) was also localized in the membrane and axon wrapping internodes. (E–E3) Cherry-fused PH domain of Swap70 (Cherry-Swap70(PH)) was localized to the cytoplasmic and nuclear compartments (asterisks) but not internode membrane (arrowheads). Scale bar in A, 15 μm. |
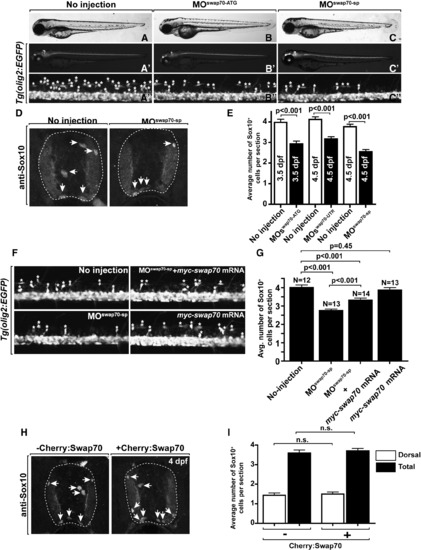
swap70 regulates OPC number. Lateral views of wild-type (A–A3), MOswap70-ATG (B–B3) and MOswap70-sp (C–C3) larvae at 3 dpf. Asterisks in A3, B3, C3 mark dorsally migrated olig2:EGFP+ OPCs. MO-injected larvae appear to have fewer OPCs than wild type. (D) Transverse sections showing Sox10+ OPCs (arrows) in the spinal cord of wild-type and MO-injected larvae at 4.5 dpf. (E) Quantification of OPCs reveals statistically fewer OPC in MO-injected larvae at 3.5 and 4.5 dpf. (F, G) swap70 overexpression by mRNA injection partially rescues the OPC deficit produced by MO knockdown. (F) Lateral view of Tg(olig2:EGFP) spinal cord at 3 dpf. Asterisks mark dorsally migrated OPCs. (G) Quantification of Sox10+ OPCs on spinal cord sections at 3 dpf shows that myc-swap70 overexpression reduces the OPC deficit caused by swap70 MO but does not alter OPC number in the absence of MO. (H, I) Transgenically induced Cherry-Swap70 does not alter OPC number or distribution. (H) Transverse sections through spinal cords of control and Cherry-Swap70 overexpressing larvae. Arrows point to Sox10+ OPCs. (I) Quantification of dorsally migrated and total OPCs in control and Cherry-Swap70 overexpressing larvae reveals no differences. White bars indicate the number of dorsally migrated OPCs. Black bars indicate the total OPC number. n.s., not significant. EXPRESSION / LABELING:
PHENOTYPE:
|
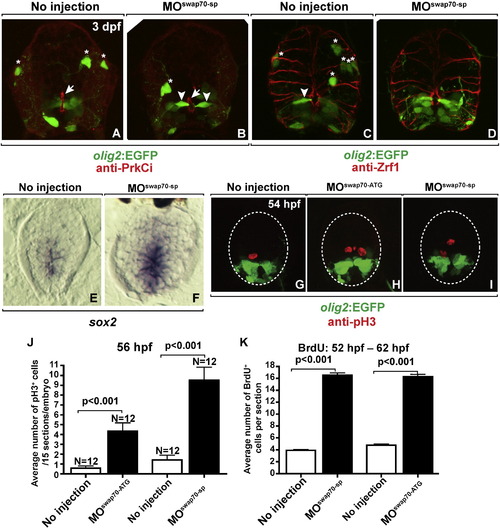
swap70 loss-of-function does not dramatically alter spinal cord development. All images show transverse sections through trunk spinal cord with dorsal up. (A, B) Anti-PrkCi immunocytochemistry performed on control and MOswap70-sp-injected larva at 3 dpf. PrkCi labeling of apical membrane (arrows) and EGFP labeling of olig2+ radial glia (arrowheads) is indistinguishable between control and experimental animals whereas fewer EGFP+ OPCs (asterisks) are evident following MOswap70-sp injection. (C, D) Anti-Zrf1 immunocytochemistry to label radial glia at 3 dpf. The shape and number of Zrf1+ radial fibers look similar in wild type and MOswap70-sp-injected larva. Arrowheads and asterisks mark EGFP+ radial glia and OPCs, respectively. (E, F) sox2 mRNA expression in the spinal cord at 3 dpf. More medial spinal cord cells express sox2 in MOswap70-sp-injected larva. (G–I) Anti-pH3 immunocytochemistry to label M-phase cells (red) on spinal cord sections of 54 hpf Tg(olig2:EGFP) embryos. In MO-injected embryos more spinal cord cells are positive for pH3. (J) Quantification of pH3 labeling. Y axis indicates total pH3 positive cells on 15 sections per embryo. N indicates number of embryos analyzed. (K) Quantification of BrdU incorporation to label S-phase cells. Embryos were soaked in BrdU solution from 52 hpf to 62 hpf. Y axis indicates number of BrdU positive cells number per section. EXPRESSION / LABELING:
PHENOTYPE:
|
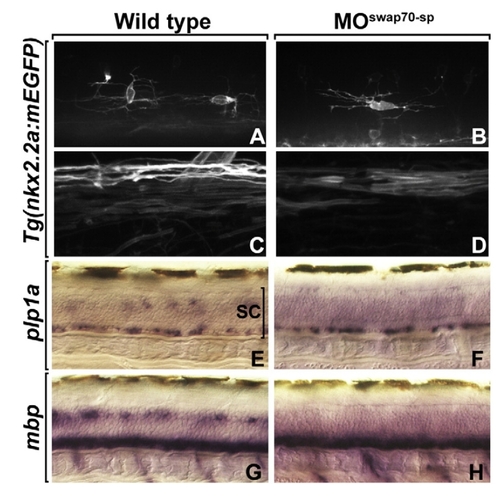
Swap70 loss-of-function does not affect OPC morphology and differentiation. Images of migrating OPCs (A, B) and wrapping oligodendrocytes (C, D) in living 3 dpf larvae visualized using a Tg(nkx2.2a:mEGFP) transgenic reporter. Membrane processes of OPCs and myelinating oligodendrocytes appear normal in MOswap70-sp-injected larvae. (E, F) plp1a mRNA expression at 3 dpf. (G, H) mbp mRNA expression at 3 dpf. Both plp1a and mbp appear to be expressed at normal levels in MOswap70-sp-injected larvae, although the number of cells expressing these genes in MO-injected larvae is fewer than in wild type. EXPRESSION / LABELING:
PHENOTYPE:
|
Reprinted from Molecular and cellular neurosciences, 48(3), Takada, N., and Appel, B., swap70 Promotes neural precursor cell cycle exit and oligodendrocyte formation, 225-35, Copyright (2011) with permission from Elsevier. Full text @ Mol. Cell Neurosci.