
- Title
-
A high level of liver-specific expression of oncogenic KrasV12 drives robust liver tumorigenesis in transgenic zebrafish
- Authors
- Nguyen, A.T., Emelyanov, A., Koh, C.H., Spitsbergen, J.M., Lam, S.H., Mathavan, S., Parinov, S., and Gong, Z.
- Source
- Full text @ Dis. Model. Mech.
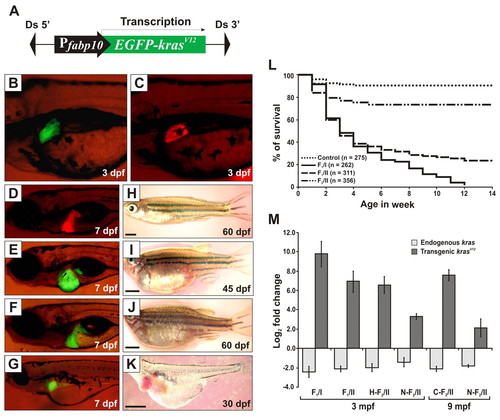
Generation and characterization of Tg(fabp10:EGFP-krasV12) transgenic zebrafish. (A) Schematic diagram of the DNA construct used to generate Tg(fabp10:EGFP-krasV12) transgenic zebrafish. Ds, maize Ds transposon sequence. (B–G) Liver-specific expression of EGFP-KrasV12 in F1 transgenic fry (B,E,F,G) as compared with the Tg(fabp10:dsRFP; elaA:EGFP) transgenic line expressing RFP in liver (Korzh et al., 2008) as normal control (C,D). (H–K) Gross observation of control fish (H) and F1 krasV12 transgenic fish (I–K). Ages of the fish are indicated. Scale bars: 2 mm. (L) Kaplan-Meier survival curves of the Tg(fabp10:EGFP-krasV12) fish for three groups of heterozygous transgenic zebrafish from F1/I (n=262), F1/II (n=311), F2/II (n=356) and WT siblings as control (n=275). (M) Determination of endogenous and transgenic kras expression levels by qRT-PCR. Log2 fold changes for endogenous and transgenic kras mRNAs were calculated against an internal housekeeping gene (β-actin) using the CT method. Histological analysis was performed to confirm their neoplastic stages before qRT-PCR (H, hyperplasia; C, carcinoma; N, normal liver). Results are presented as the mean ± s.d. and each bar represents five biological replicates. EXPRESSION / LABELING:
PHENOTYPE:
|
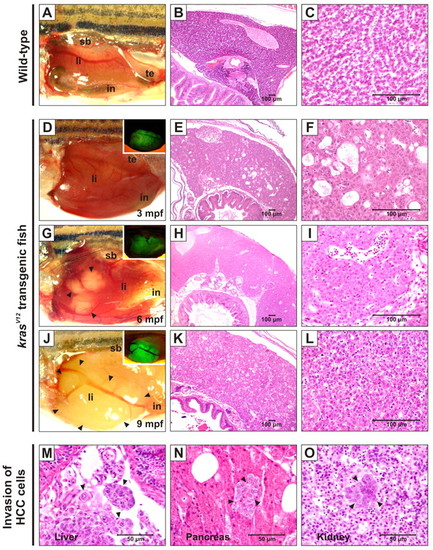
Liver tumor progression in krasV12 transgenic zebrafish. Abbreviations: in, intestine; li, liver; sb, swimbladder; te, testis. (A–C) Gross morphology and histology of WT zebrafish showing normal liver and tissue architecture. (D–L) Gross morphology and histology of F2/II krasV12 zebrafish. (D,G,I) Brightfield and fluorescence (insets) images displaying the progressive stages of liver tumors at 3, 6 and 9 mpf. Various tumor protrusions are indicated by arrowheads. Corresponding histological sections are shown in the same rows. Livers were observed at 3 mpf (D) and histological appearance revealed multifocal mild-to-moderate cystic degeneration (spongiosis hepatis) and diffused moderate hepatocellular hyperplasia (E,F). Many white nodules were developed in transgenic liver at 6 mpf (G) and their histology indicated hepatocellular adenoma containing vacuolated clear cells with increased cytoplasmic glycogen (H,I). Malignant tumors were visibly observed at around 9 mpf (J) and histological analysis confirmed that the tumor was HCC grade II–III (K,L). (M–O) Invasion of HCC cells (indicated by arrowheads) into blood vessels (M) and adjacent tissues, namely pancreas (N) and kidney (O). PHENOTYPE:
|
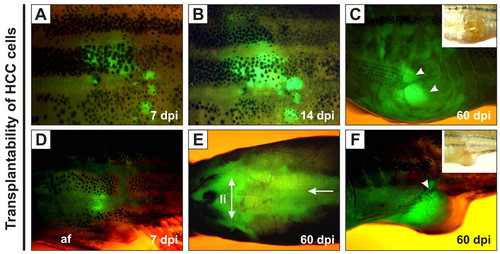
Growth of transplanted krasV12 liver tumors in WT recipients. (A–F) EGFP-positive HCC cells were transplanted intraperitoneally into irradiated recipients. (A,D) EGFP fluorescence was observed near the sites of injection at 7 dpi. af, anal fin. (B) Transplanted cells proliferated by 14 dpi. (E) Extensive infiltration of tumor cells along the peritoneal cavity (arrow), especially in the region surrounding the liver (li; double-headed arrow), was observed at 60 dpi. (C,F) The outgrowth of EGFP-positive tumor mass (arrowheads) penetrated into the abdominal wall and/or peritoneal cavity at 60 dpi. |
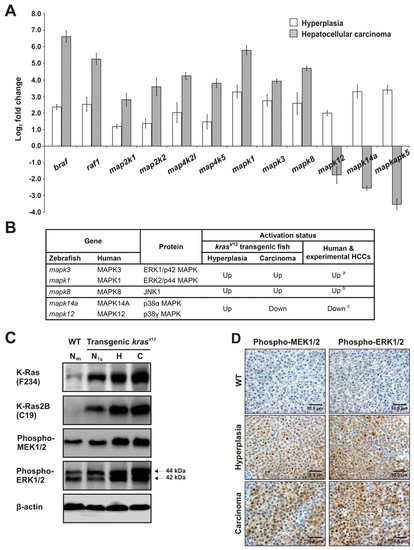
Hyperactivation of the MAPK signaling pathway in krasV12 transgenic zebrafish. (A) Determination of expression levels of various kinase genes by qRT-PCR in liver hyperplasia (3 mpf) and carcinoma (9 mpf). The expression levels of these genes in each WT and transgenic liver sample were first measured and normalized with the expression level of β-actin (n=5 each). The log2 fold changes in expression in the transgenic samples as compared with matched WT sample are presented. (B) Comparison of MAPK family expression during liver tumorigenesis in krasV12 transgenic zebrafish, human liver cancer and other experimental models of HCC. a(Schmidt et al., 1997); b(Wurmbach et al., 2007; Chang et al., 2009); c(Wurmbach et al., 2007). (C) Western blots of total proteins from WT normal liver (NWt) and kras V12 transgenic liver showing normal liver morphology (NTg), hyperplastic liver (H) or HCC (C) to detect total Kras (F234), Kras2B (C19) isoform, phospho-MEK1/2 and phospho-ERK1/2 (also known as phospho-p44/42 MAPK). Arrows: double bands of phospho-ERK1/2 (44 kDa and 42 kDa). β-actin, internal control for equal loading. (D) Immunohistochemical analysis of paraffin-embedded liver sections from WT (control; top row), 3-mpf transgenic (hyperplasia; middle row) and 9-mpf transgenic (carcinoma; bottom row) fish. Sections were stained with antibodies against phospho-MEK1/2 or phospho-ERK1/2. Scale bars: 10 μm. |
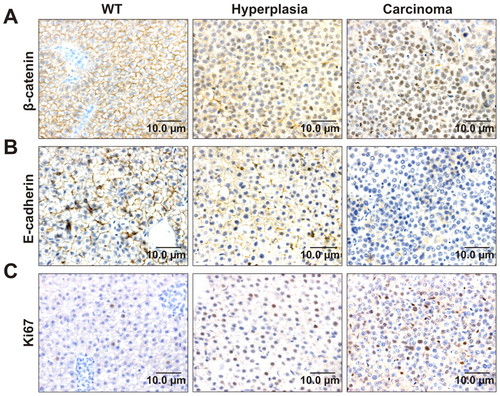
Activation of the Wnt–β-catenin pathway during krasV12 liver tumorigenesis. Representative immunohistochemical liver sections from WT zebrafish as the control and krasV12 transgenic fish with liver hyperplasia and carcinoma are shown. (A) Immunohistochemistry for β-catenin showing an increasing nuclear localization of β-catenin during HCC progression. (B) Immunohistochemistry for E-cadherin showing loss of membranous E-cadherin expression during tumor growth. (C) Immunohistochemistry for Ki67 showing a high expression level of Ki67 in cell nuclei, which increased from hyperplasia to carcinoma. PHENOTYPE:
|
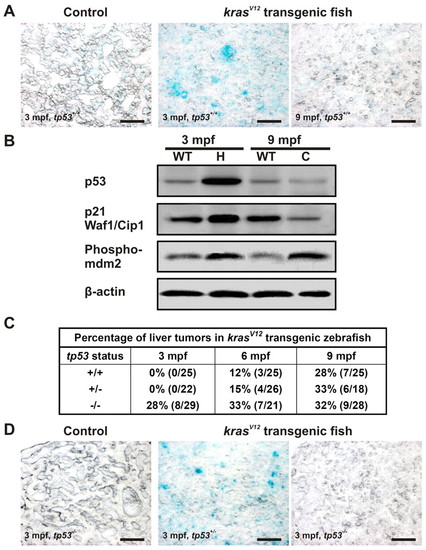
KrasV12-induced p53-dependent senescence in the pre-neoplastic liver. (A) Oncogenic KrasV12-induced senescence at an early stage of liver tumor development. SA-βgal staining was performed on liver cryosections from 3- and 9-mpf krasV12 transgenic and WT fish (tp53+/+). (B) Western blots of total proteins from liver hyperplasia (H), carcinoma (C) and age-matched WT liver to evaluate the levels of tumor suppressor p53 together with its target, p21 Waf1/Cip1, and its regulator, phospho-MDM2, during tumorigenesis. β-actin, internal control for equal loading. (C) Acceleration of liver tumor onset in homozygous tp53M214K mutant transgenic fish. Percentages of tumors observed from krasV12 transgenic fish with different p53 backgrounds at different time points are shown. (D) Suppression of senescence induced by oncogenic krasV12 in tp53-/- background. SA-βgal staining was performed with four biological replicates in each group. Scale bars: 50 μm. PHENOTYPE:
|
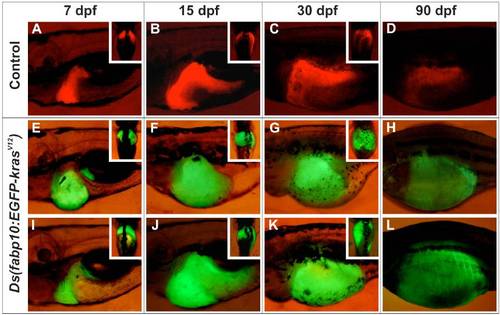
Morphological development of liver in transgenic fish expressing EGFP-krasV12. Comparison of liver morphogenesis between LiPan control [Tg(fabp10:dsRFP; elaA:EGFP)] zebrafish (A-D) and two representative cases of abnormal liver morphology distinguished by different degrees of liver enlargement/hyperplasia at the early stages (E-H and I-L) observed in the F1/I Tg(fabp10:EGFP-krasV12) zebrafish. Note that there were no obvious differences between these two cases at the later stages. (A,E,I) 7 dpf (day post-fertilization); (B,F,J) 15 dpf; (C,G,K) 30 dpf; (D,H,L) 90 dpf. All big images are lateral view whereas all insets are ventral view. |
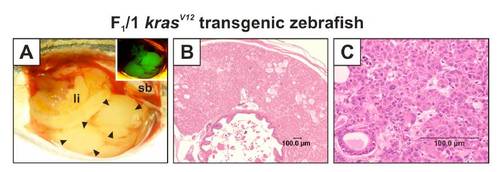
Morphological and histological examination of liver tumor of F1/I transgenic fish. (A) Liver from transgenic male fish of line F1/I (84 dpf) displaying macroscopic tanned nodules. (B,C) Histological observations confirmed mixed carcinoma with hepatocellular component grade III. |