
- Title
-
Regulator of g protein signaling 3 modulates wnt5b calcium dynamics and somite patterning
- Authors
- Freisinger, C.M., Fisher, R.A., and Slusarski, D.C.
- Source
- Full text @ PLoS Genet.
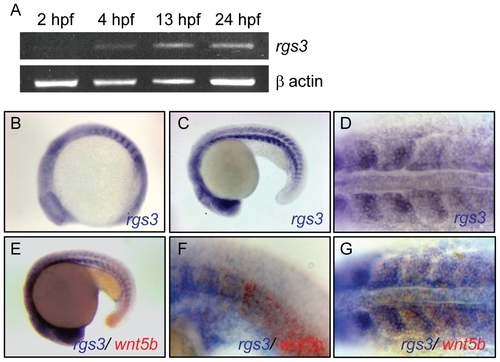
Temporal and spatial expression of rgs3 throughout zebrafish development. RT-PCR was used to determine the temporal expression of rgs3 from 0 hpf to 24 hpf (A). Whole Mount In Situ Hybridization was utilized to determine the spatial expression of rgs3 in 12 hpf (B) and 20hpf (C,D) wild type embryos. rgs3 and wnt5b double label in situ in18hpf embryos (E–G). Lateral (B,C,E,F) and dorsal (D,G) views illustrate that rgs3 is expressed in the developing somites (B–D) and posterior tail (C). At 18 hpf rgs3 expression is enriched in the posterior (caudal) portion of the developing somites (D). Co-localization of wnt5b and rgs3 was determined by double label WMISH with wnt5b (red) and rgs3 (blue) showing overlapping expression domains in the developing tail and somites (E–G). Sense probes (negative control) gave no specific hybridization signal. |
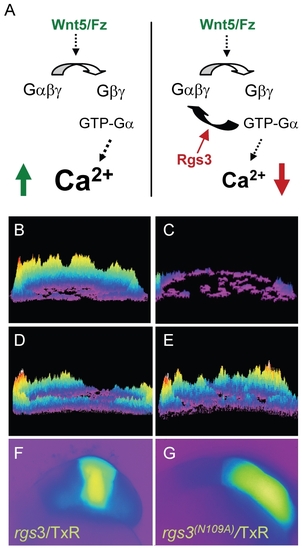
rgs3 inhibits wnt5b-induced Ca2+ dynamics. Schematic representation illustrating that Wnt5b overexpression results in intracellular calcium release in a G protein dependent manner (A, left side) and the predicted negative effect overexpression of Rgs3 will have on the Wnt/calcium pathway (A, right side). Representative Ca2+ release profiles (composite image) of wnt5-overexpressing (B,D,E) and wt (C) blastula stage zebrafish embryos. (B–E) are composites of fura-2 ratiometric imaging time course showing total calcium release activity as peaks and colors mapped topographically. Ca2+ release profile of an embryo uniformly expressing wnt5b (B). Wt Ca2+ release profile (C). wnt5b expressing embryo with localized TxR/rgs3 (D) or Txr/rgs3N109A (E). Corresponding fluorescent images illustrate the location of TxR/rgs3 (F) and TxR/rgs3N109A (G). |

rgs3 morphant phenotypes and functional rescue. Schematic of zebrafish rgs3 mRNA/protein composite (A). Numbers refer to the amino acid number of the encoded Rgs3 protein, while the locations of morpholino binding sites employed in later experiments are indicated by red lines above the transcript. MO = rgs3 MO, MOb = rgs3 MOb and SA = rgs3 MOsa. The RGS domain of Rgs3, amino acids 43–158, is highlighted by the black box (A). Western analysis demonstrates that myc-tagged rgs3 and rgs3N109A proteins are detectable from 5 hpf to 24 hpf (B). Antisense morpholino-mediated gene knockdown of rgs3 results in embryonic defects. Lateral views of 28 hpf wild-type (C,E) and rgs3 MO injected (D,F) embryos illustrate that rgs3 morphants have a reduced body length (D) and altered somite formation (F). rgs3 was co-injected with rgs3 MO to monitor rescue of gene knockdown. The molecular markers krox20, myoD and pax2 were used to evaluate rgs3 morphant rescue (G–Q). krox 20 labels rhombomeres 3 and 5, myoD labels the developing somites and adaxial cells while, pax2 labels the otic vesicle (o), midbrain-hindbrain boundary (MHB) and eye (E). Lateral (G and O–Q) and dorsal (H–N) views, anterior to the right, of 15 hpf (G–N) and 20 hpf (O–Q) wt embryos injected with Control MO (G,H,K,L,O), rgs3 MO (I,M,P) and rgs3 MO+rgs3 (J,N,Q). Boxed regions in G and K represent the areas magnified in H–J and L–N respectively. Asterisks indicate the spacing and width of three representative somites (L–N). krox20, myoD and pax2 expression patterns indicate that rgs3 is able to suppress the morpholino-induced defect (J,N,Q). For structural functional analyses, rgs3N109A was evaluated for rescue of knockdown. Morphological analyses reveals that rgs3 is able to suppress the MO induced defect (R) while, rgs3(N109A) is unable to suppress the MO induced defect (R). PHENOTYPE:
|
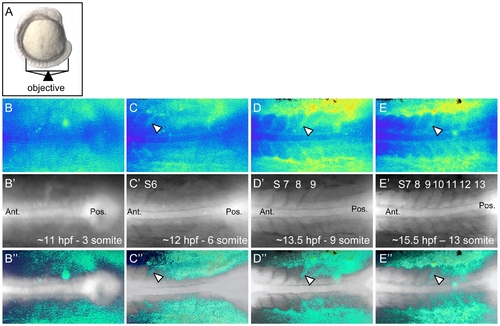
Ca2+ dynamics during zebrafish somitogenesis. Illustration of the position of a 10 somite stage (14 hpf) zebrafish embryo relative to the objective during Ca2+ imaging (A). Representative ratio images, pseudocolored with low ratio (low Ca2+) represented by blue and high ratio (high Ca2+) represented by yellow/red, of 3, 6, 9 and 13 somite stage embryos (B–E respectively). The forming somites and notochord can be identified by the grayscale fluorescence images (B′–E′). Overlay of grayscale and ratio images illustrate the regions of Ca2+ release activity relative to morphology (B″–E″). Arrowheads indicate areas of sustained Ca2+ activity between forming somites. Ant. = Anterior, Pos. = Posterior and S = somite number. |
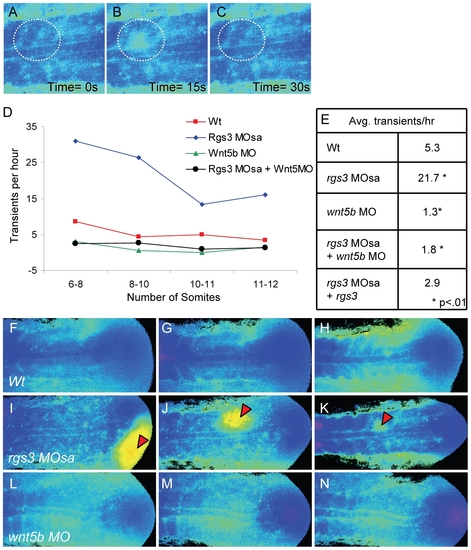
rgs3 impacts segmentation stage Ca2+ dynamics. Zebrafish embryos injected with Fura-2 were oriented in a dorsal posterior view. Representative ratio images, pseudocolored with low Ca2+ represented by blue, and high Ca2+ represented by yellow/red (A–C,F–N). During somitogenesis, Ca2+ transients are identified as a local short-lived increase in intracellular Ca2+ levels. A region of interest (ROI) is noted by a dashed circle highlighting a representative Ca2+ transient (A–C). In the ROI from time 0s to time 15s, an increase in Ca2+ levels is observed (B) that subsides by time 30s (C). The number of transients as a function of developmental age (D). Table depicting the average number of Ca2+ transients per hour from 6 to 12 somite stage for each treatment (E). Representative ratio images of 5 somite stage (F), 7 somite (G) and 10 somite stage (H) wt embryos taken from Video S1. Representative ratio images of 5 somite (I), 7 somite (J) and 10 somite stage (K) rgs3 MOsa injected embryo taken from Video S2. Representative ratio images of 5 somite (L), 7 somite stage (M) and 10 somite stage (N) wnt5b MO injected embryo taken from Video S4. Red arrowheads indicate large Ca2+ transients in rgs3 morphant embryos (I–K) that are not observed in wt (F–H) or wnt5b morphant embryos (L–N). PHENOTYPE:
|
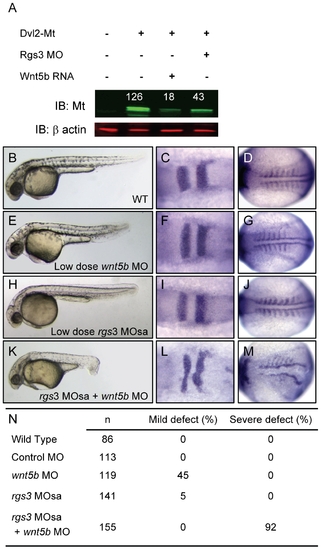
rgs3 interacts with the Wnt-signaling network. Western analysis demonstrates that Dvl-MT levels are reduced by both wnt5b overexpression as well as Rgs3 knockdown (A). Odyssey Infrared Imaging System was used to quantify the relative intensity of Dvl-MT normalized to the β actin loading control and shown as numbers above the IB:MT bands. Low doses of rgs3 and wnt5b MOs were used to test genetic interaction (B–N). Phenotypes were characterized by morphology (B,E,H,K,N) and the molecular markers krox20 (C,F,I,L) and myoD (D,G,J,M). Lateral images of 34 hpf wt (B), low dose wnt5b MO (E), low dose rgs3 MOsa (H), and wnt5b MO+rgs3 MOsa (K) injected embryos. Dorsal images of 13hpf wt (C,D), low dose wnt5b MO (F,G), low dose rgs3 MOsa (I,J), and wnt5b MO+rgs3 MOsa (L,M) injected embryos. Low dose wnt5b MO+rgs3 MOsa resulted in a 92% penetrance of severe defects which were not observed with low dose wnt5b MO or low dose rgs3 MOsa alone (N). PHENOTYPE:
|
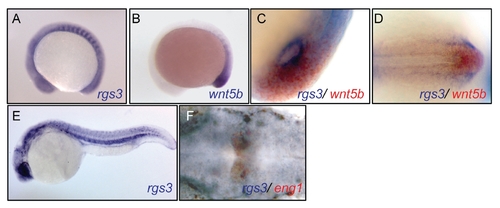
rgs3 expression is adjacent and overlapping with wnt5b, related to Figure 1. Temporal and spatial expression of rgs3 compared to wnt5b in zebrafish development. Whole Mount In Situ Hybridization was utilized to compare the spatial expression of wnt5b to rgs3. WMISH of 14hpf (A–D) and 24hpf (E–F) Wt embryos. Lateral (A–C and E) and dorsal (D and F) views illustrate that rgs3 is expressed in the developing somites and posterior tail (A–E). Co localization of wnt5b and rgs3, determined by double label WMISH with wnt5b (red) and rgs3 (blue), shows adjacent and overlapping expression domains around Kupffer′s vesicle (C) and in the tailbud (D). Double label WMISH with rgs3 (blue) and engrailed1 (red) highlight that rgs3 is expressed in the midbrain/hindbrain boundary (E). Sense probes (negative control) gave no specific hybridization signal. EXPRESSION / LABELING:
|
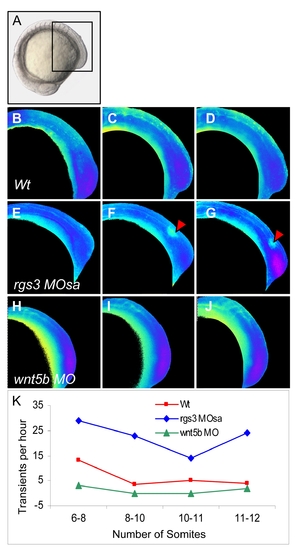
rgs3 impacts segmentation stage calcium dynamics, related to Figure 5. Zebrafish embryos injected with Fura-2 oriented in a lateral posterior view (A) with a focus on the developing somites and tail (boxed region). Ratio images, pseudocolored to represent low Ca2+ as blue and high Ca2+ as yellow/red (B–J). Representative ratio images of 6 somite stage (B, E and H), 8 somite stage (C, F, and I) and 10 somite stage (D, G and J) embryos. Arrowheads indicate large Ca2+ transients in rgs3 morphant embryos (E–G) that are not observed in Wt (B–D) or wnt5b morphant embryos (H–J). The number of Ca2+ transients per hour observed in embryos oriented in a lateral posterior view from 6 to 12 somite stage is represented function of developmental age is represented graphically (K). PHENOTYPE:
|