
|
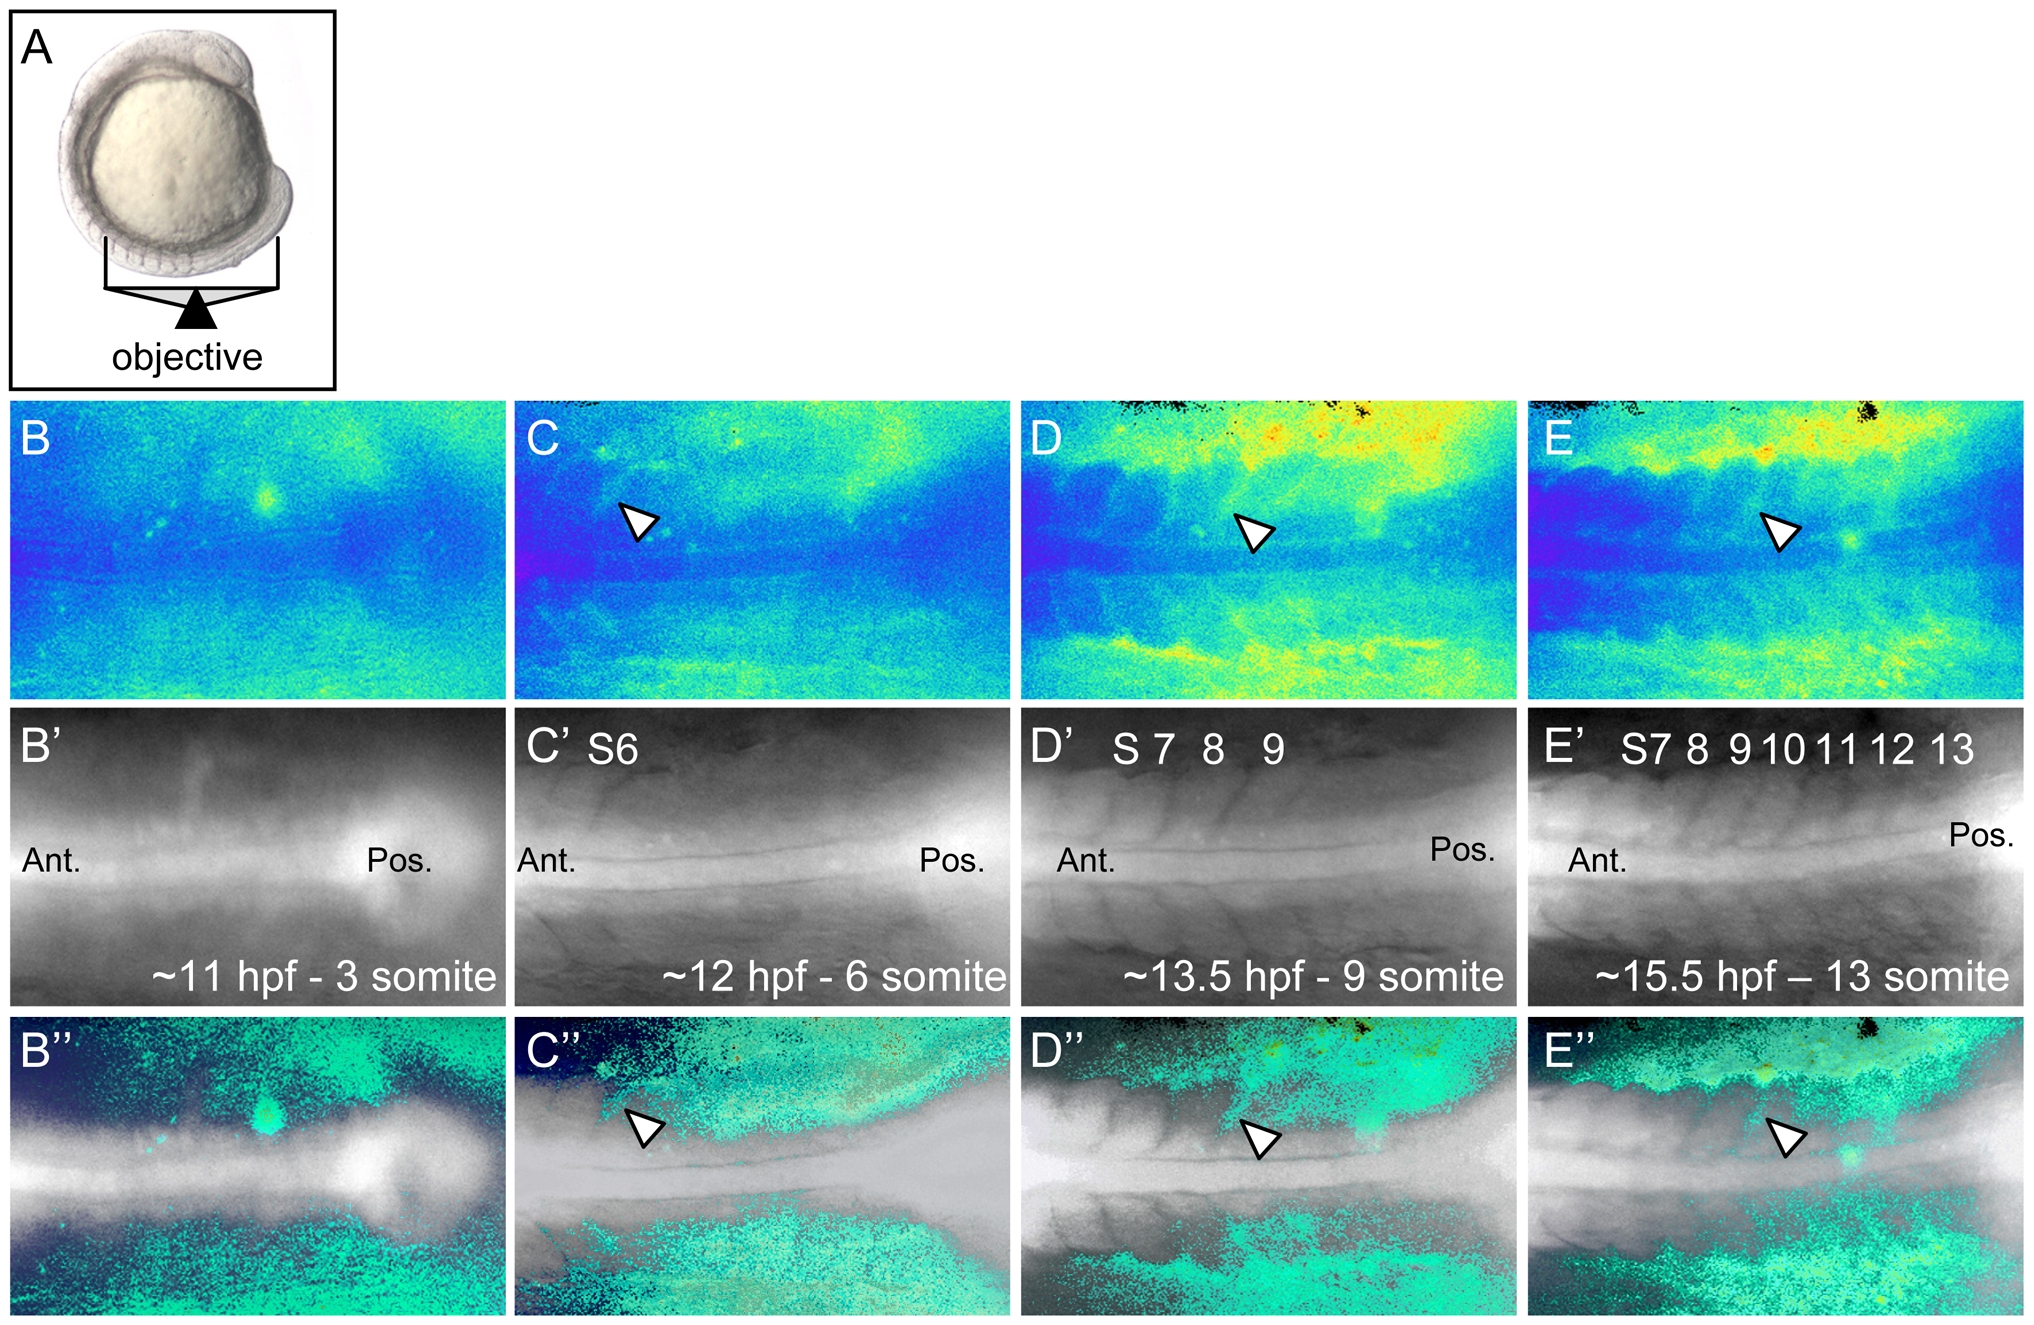
Fig. 4 Ca2+ dynamics during zebrafish somitogenesis.
Illustration of the position of a 10 somite stage (14 hpf) zebrafish embryo relative to the objective during Ca2+ imaging (A). Representative ratio images, pseudocolored with low ratio (low Ca2+) represented by blue and high ratio (high Ca2+) represented by yellow/red, of 3, 6, 9 and 13 somite stage embryos (B–E respectively). The forming somites and notochord can be identified by the grayscale fluorescence images (B′–E′). Overlay of grayscale and ratio images illustrate the regions of Ca2+ release activity relative to morphology (B″–E″). Arrowheads indicate areas of sustained Ca2+ activity between forming somites. Ant. = Anterior, Pos. = Posterior and S = somite number.