
Fig. 6
- ID
- ZDB-FIG-100723-36
- Publication
- Freisinger et al., 2010 - Regulator of g protein signaling 3 modulates wnt5b calcium dynamics and somite patterning
- Other Figures
- All Figure Page
- Back to All Figure Page
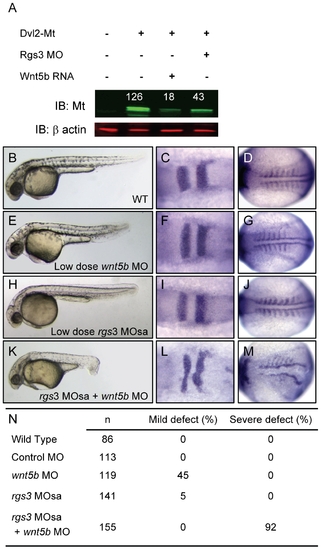
rgs3 interacts with the Wnt-signaling network. Western analysis demonstrates that Dvl-MT levels are reduced by both wnt5b overexpression as well as Rgs3 knockdown (A). Odyssey Infrared Imaging System was used to quantify the relative intensity of Dvl-MT normalized to the β actin loading control and shown as numbers above the IB:MT bands. Low doses of rgs3 and wnt5b MOs were used to test genetic interaction (B–N). Phenotypes were characterized by morphology (B,E,H,K,N) and the molecular markers krox20 (C,F,I,L) and myoD (D,G,J,M). Lateral images of 34 hpf wt (B), low dose wnt5b MO (E), low dose rgs3 MOsa (H), and wnt5b MO+rgs3 MOsa (K) injected embryos. Dorsal images of 13hpf wt (C,D), low dose wnt5b MO (F,G), low dose rgs3 MOsa (I,J), and wnt5b MO+rgs3 MOsa (L,M) injected embryos. Low dose wnt5b MO+rgs3 MOsa resulted in a 92% penetrance of severe defects which were not observed with low dose wnt5b MO or low dose rgs3 MOsa alone (N). |
| Fish: | |
|---|---|
| Knockdown Reagents: | |
| Observed In: | |
| Stage Range: | 5-9 somites to Prim-15 |